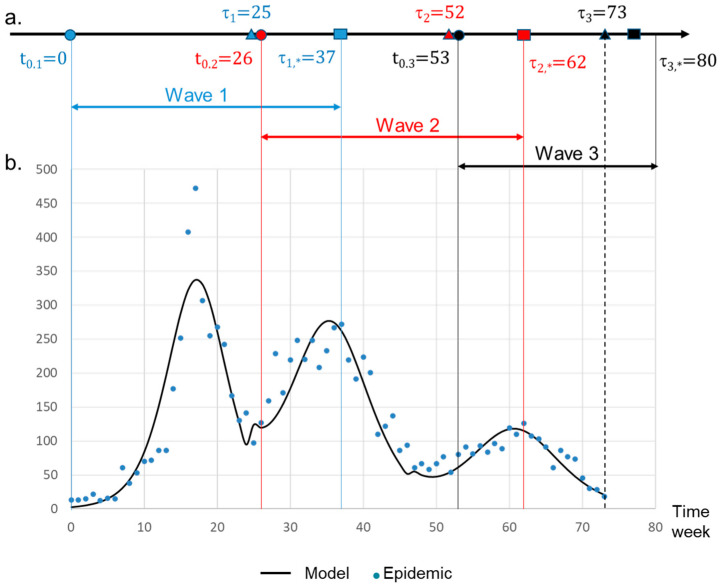
Figure 3.
Derivative mathematical model of the 2011–2012 HFMD epidemic dynamic. (a) Timeline parameters. The theoretical curve is obtained by the derivative of the function XG(t). Beginning of a wave is labeled t0. The time τ corresponds to the last known case for a given wave. The time τ* is an estimation of τ obtained by the model (Equation (3)). Beginning (t = 0 in the model) of wave 1 was set at week 16 (Supplemental Table S1). (b) Evolution of the number of cases per week. Dots are associated with the observed values. The solid curve is the theoretical number of cases.

