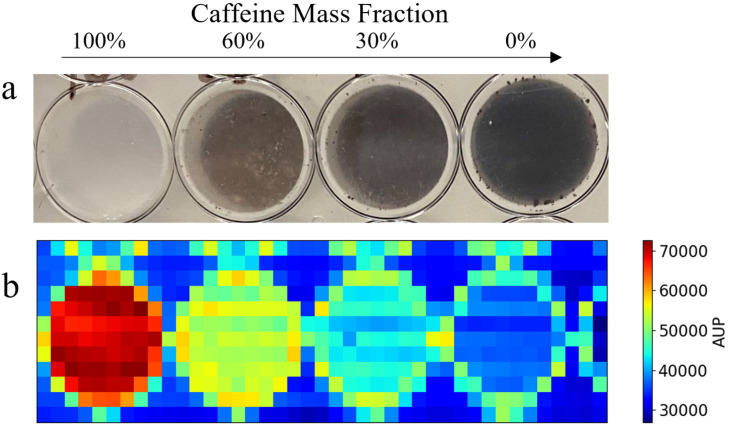
Figure 6.
Two-dimensional spatially resolved scattering map output using raster scan data. (a) A well plate sample containing four distinct mass fractions of caffeine. (b) The corresponding scattering map, generated using the area under the peak (AUP) values from 7 to 9 nm−1. The AUP q-range is defined by the user in the input to use the first peak of caffeine to create the planar image.

