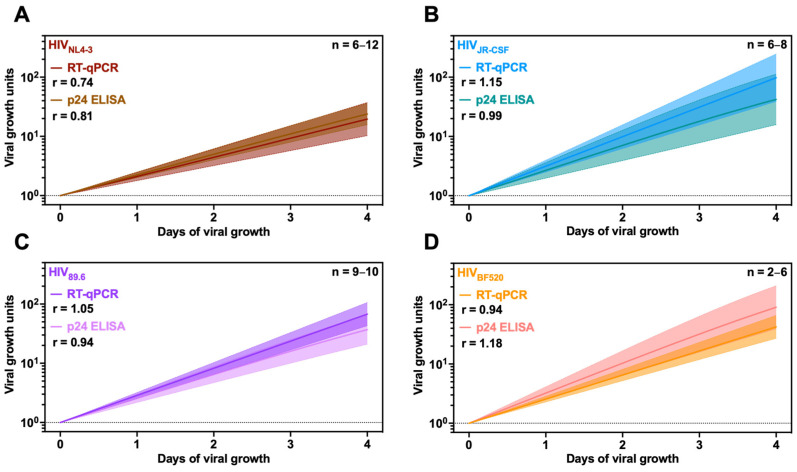
Figure 4.
Evaluation of viral growth of four different HIV-1 isolates by p24 ELISA and QuickFit RT-qPCR. (A) HIVNL4-3, (B) HIVJR-CSF, (C) HIV89.6, and (D) HIVBF520 growth rates were determined using the QuickFit pipeline by p24 ELISA (lighter shades) and RT-qPCR (darker shades). Viral growth (p24 concentration or GC/mL) was calculated by normalizing the initial value on day 0 to either 1.00 pg/mL or 1.00 GC/mL and subsequently interpolating the remaining values (filtered by inclusion and exclusion criteria) from days 1 to 4 based on the fit curve model. Overlaid is the mean growth rate and the 95% confidence interval. The r value represents the average growth rate determined by each assay for all included samples. The dotted lines represent the limit of detection for each assay.

