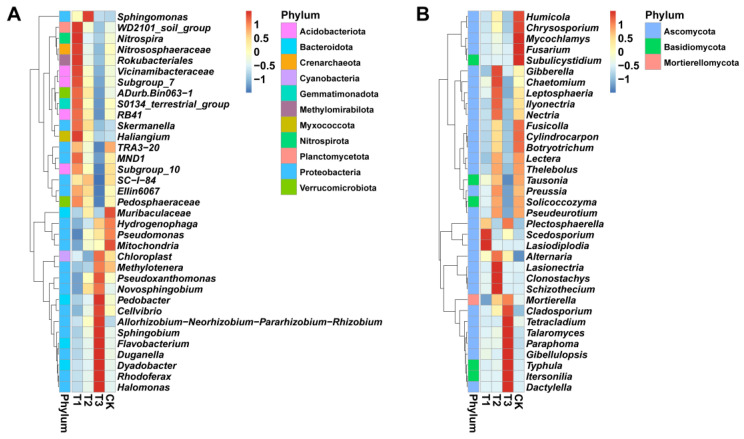
Figure 3.
The analysis of the patterns of taxonomic distribution and soil microbial composition at the genus level. The relative abundance heat maps and phylum-level cluster maps of the top 35 bacteria (A) and fungi (B) under different treatments. Application of SCZFN (T1), application of Bacillus subtilis wettable powder (T2), application of fungicide Apron Advance (T3), and application of water (CK).

