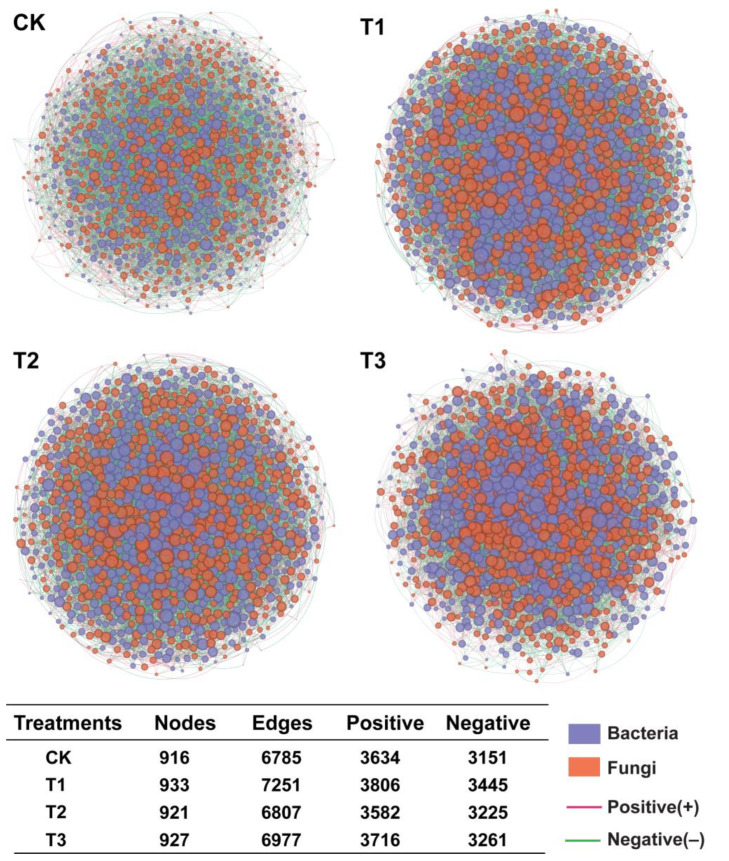
Figure 5.
Co-occurrence networks analysis of bacterial and fungal communities at genus level under different treatments. Nodes represent microbial genera, and edges represent the interaction between microbes within a specific treatment, including the number of positive and negative edges. Application of SCZFN (T1), application of Bacillus subtilis wettable powder (T2), application of fungicide Apron Advance (T3), and application of water (CK).

