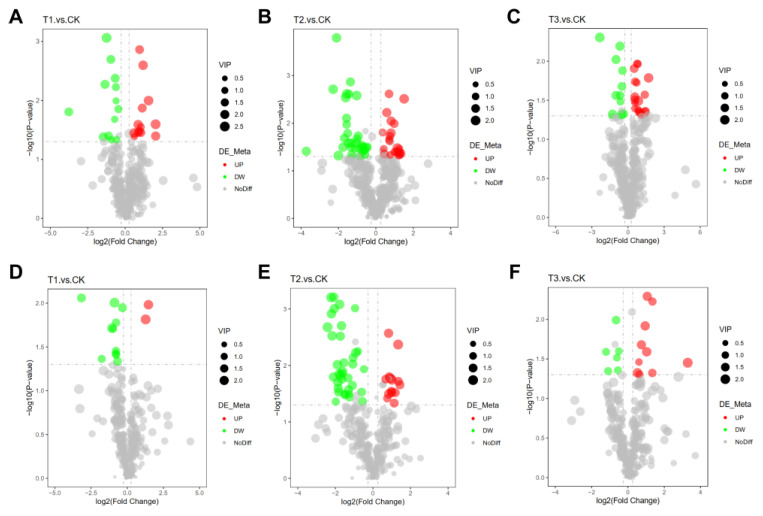
Figure 7.
The analysis of d differentially expressed metabolites after comparison of different treatments and controls. The presence of intersecting numbers signifies shared DEMs, while the absence of intersections indicates unique DEMs. Volcano map of the overall distribution of DEMs. (A–C) DEMs of different treatments compared to CK in positive mode, (D–F) DEMs of different treatments compared to CK in negative mode. The horizontal coordinate represents the difference in multiple changes of metabolites in different groups (log2(fold change)), and the vertical coordinate represents the difference in significance level (−log10(p-value)). Each point represents a metabolite. Significantly up-regulated metabolites are represented by red dots, and significantly down-regulated metabolites are represented by green dots. The size of the dot represents the VIP value. Application of SCZFN (T1), application of Bacillus subtilis wettable powder (T2), application of fungicide Apron Advance (T3), and application of water (CK).

