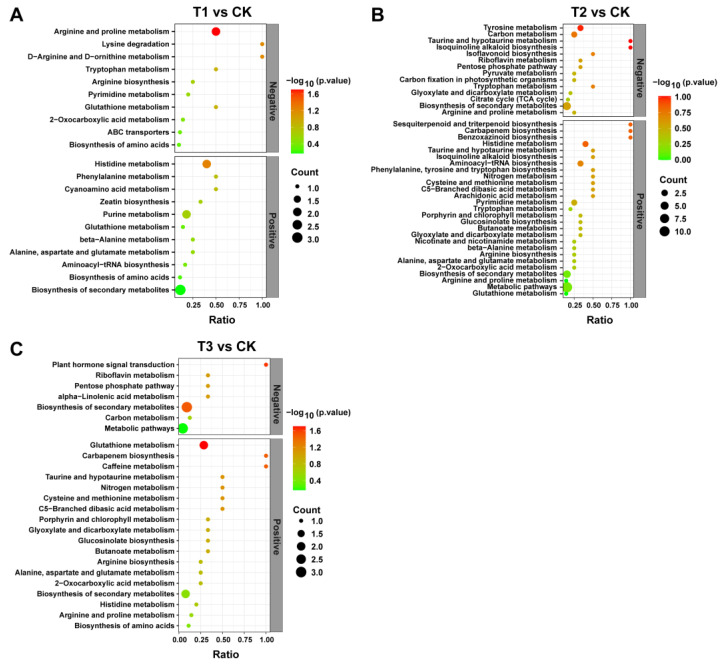
Figure 8.
Analysis of KEGG enrichment pathway between treatments compared to CK in two ion modes (A–C). The horizontal coordinate is the ratio of the number of differentiated metabolites in the corresponding metabolic pathway to the total number of identified metabolites in the pathway, and the vertical coordinate represents the difference in significance level (−log10(p-value)). The size of the dots represents the number of differentiated metabolites in the corresponding pathway. Application of SCZFN (T1), application of Bacillus subtilis wettable powder (T2), application of fungicide Apron Advance (T3), and application of water (CK).

