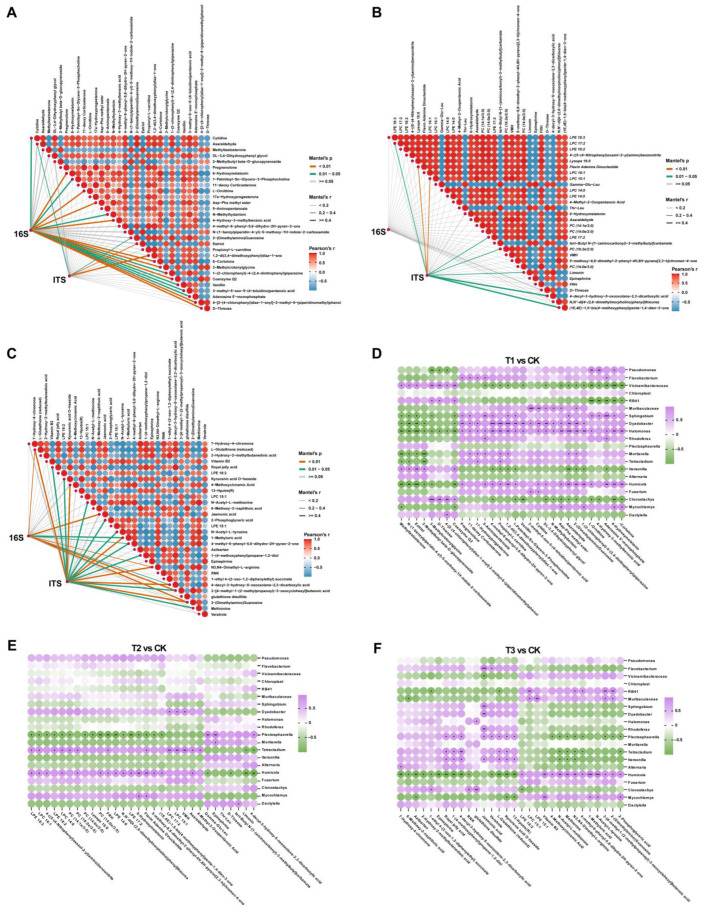
Figure 9.
Interactions between different expressed metabolites and differential microbial communities with different treatments compared to CK. The interactions among the top 30 distinct metabolites (The top 15 of each of the two ion modes) and diverse microbial communities were compared to CK under various treatments. (A–C) Correlations of the microbial community and top 30 DEMs were determined using the Mantel test. (D–F) Correlations analysis of the Top 10 bacterial-fungal genera and Top 30 DEMs according to Pearson correlation coefficient. Asterisks indicates significant differences (* p < 0.05; ** p < 0.01; *** p < 0.001). Application of SCZFN (T1), application of Bacillus subtilis wettable powder (T2), application of fungicide Apron Advance (T3), and application of water (CK).

