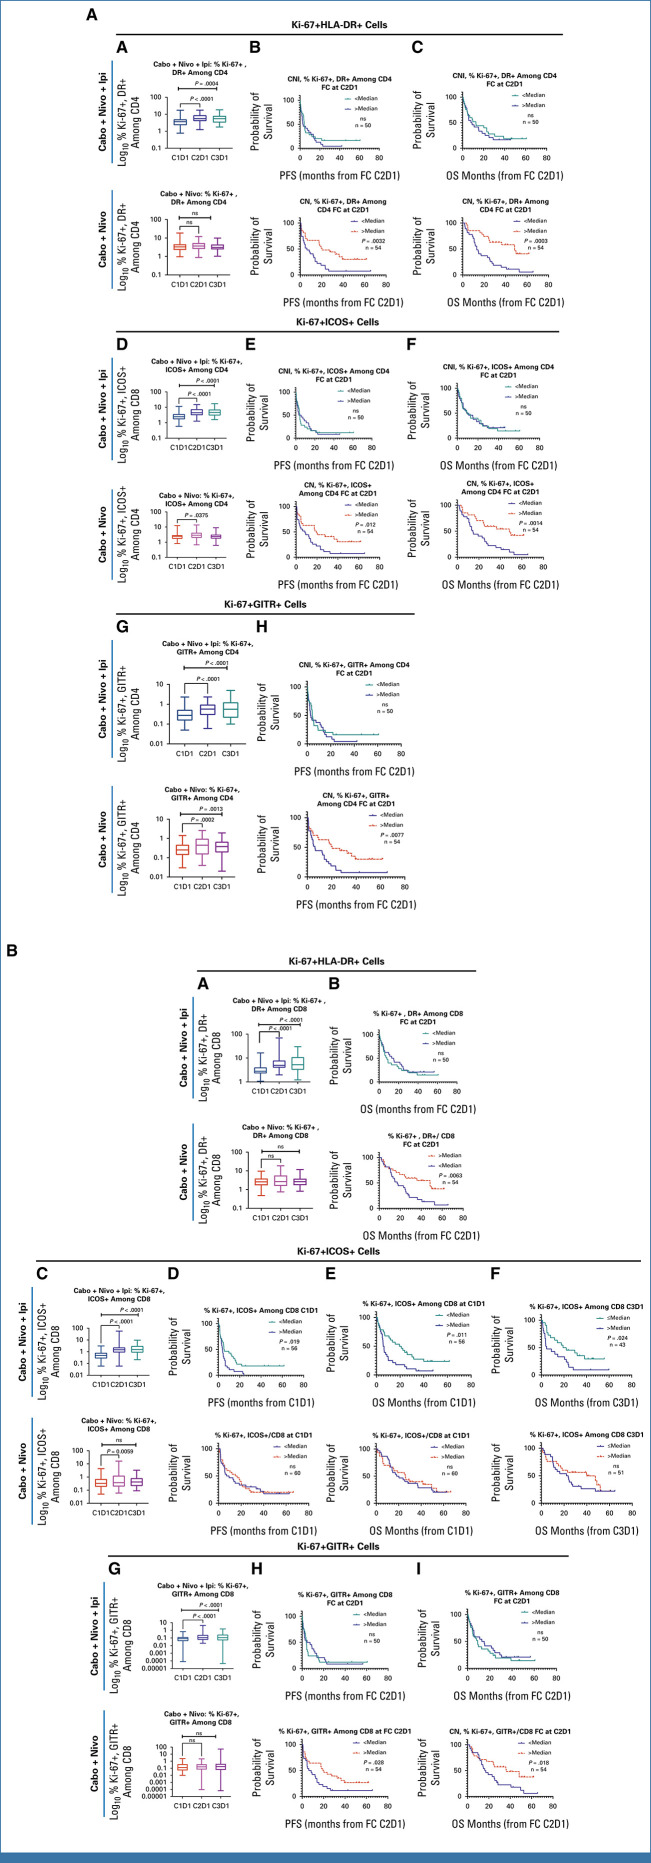
FIG A4.
(A) Effect on Ki-67+, activated CD4+ T cells. (A) Percentage of Ki-67+HLA-DR+ cells among total CD4+ T cells markedly increased at C2D1 and C3D1 with CaboNivoIpi. (B, C) Higher fold change in percentage of Ki-67+HLA-DR+ cells at C2D1 was associated with better (B) PFS and (C) OS with CaboNivo. (D) Percentage of Ki-67+ICOS+ cells markedly increased at C2D1 and C3D1 with CaboNivoIpi and increased at C2D1 with CaboNivo. (E, F) Lower-than-median percentage of Ki-67+ICOS+ cells at baseline was associated with poor (E) PFS and (F) OS with CaboNivo. (G) Percentage of Ki-67+GITR+ cells markedly increased at C2D1 and C3D1 with both treatments. (H) Higher fold change in percentage of Ki-67+GITR+ cells at C2D1 with CaboNivo was associated with better PFS. (B) Effect on Ki-67+, activated CD8+ T cells. (A) Percentage of Ki-67+HLA-DR+ cells among total CD8+ T cells greatly increased at C2D1 and C3D1 with CaboNivoIpi. (B) Higher fold change in percentage of Ki-67+HLA-DR+ T cells at C2D1 with CaboNivo was associated with better OS. (C) Percentage of Ki-67+ICOS+ cells among total CD8+ T cells greatly increased at C2D1 and C3D1 with CaboNivoIpi and increased at C2D1 with CaboNivo. (D, E) Higher-than-median percentage of Ki-67+ICOS+ cells at baseline was associated with poor (D) PFS and (E) OS with CaboNivoIpi. (F) Higher-than-median percentage of Ki-67+ICOS+ cells at C3D1 was associated with poor OS with CaboNivoIpi. (G) Percentage of Ki-67+GITR+ cells among total CD8+ T cells greatly increased at C2D1 and C3D1 with CaboNivoIpi. (H, I) Higher fold change in percentage of Ki-67+GITR+ cells at C2D1 with CaboNivo was associated with better (H) PFS and (I) OS. FC, fold change; OS, overall survival; PFS, progression-free survival.

