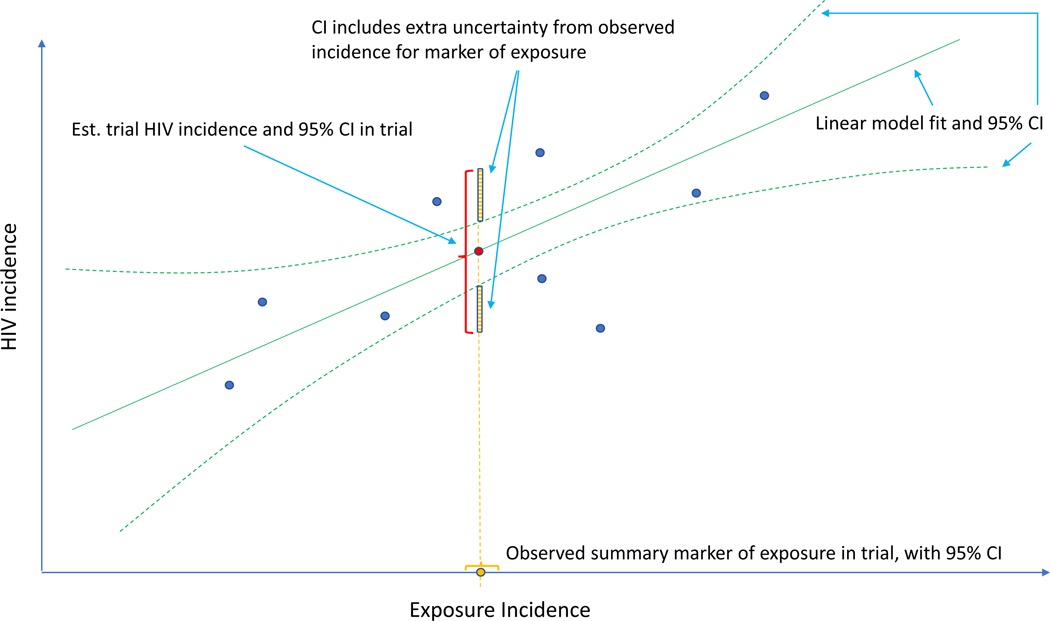
Figure 1.
Estimation of counterfactual HIV incidence based on an HIV exposure marker. Green solid and dashed curves correspond to the fitted model associating HIV and exposure marker incidences with an associated pointwise 95% confidence interval (CI), based on a set of external cohorts reporting HIV and exposure marker incidence rates (dark blue dots). Given the exposure marker incidence in the active-controlled trial (yellow dot), counterfactual placebo HIV incidence is estimated with use of the fitted model (red dot). The 95% CI for the counterfactual placebo incidence captures uncertainty due to the model fit and uncertainty in the exposure marker incidence.

