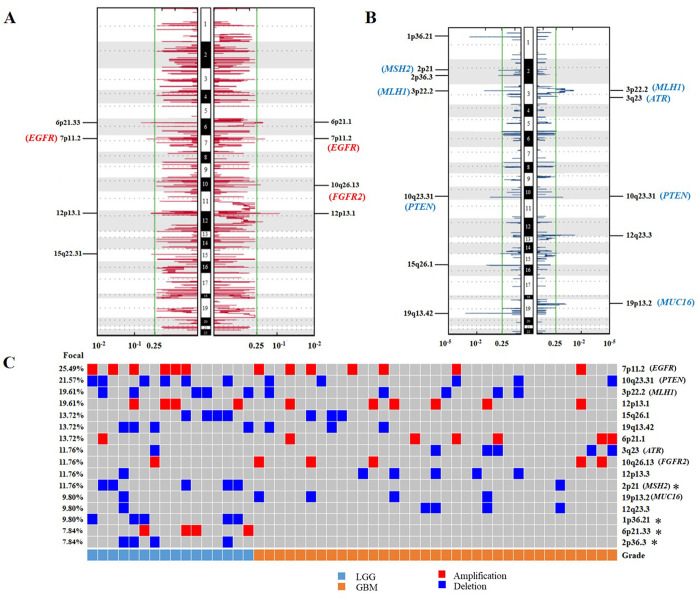
Fig 3. Differential CNVs between LGG and GBM.
(A) Amplification regions in LGG (left) and GBM (right). (B) Deletion regions in LGG (left) and GBM (right). (C) Percentage of CNVs located in different chromosomal regions in LGG and GBM. The green line indicates the cut-off of significance (q = 0.25). Significance was calculated using Fisher’s exact test, *p < 0.05.

