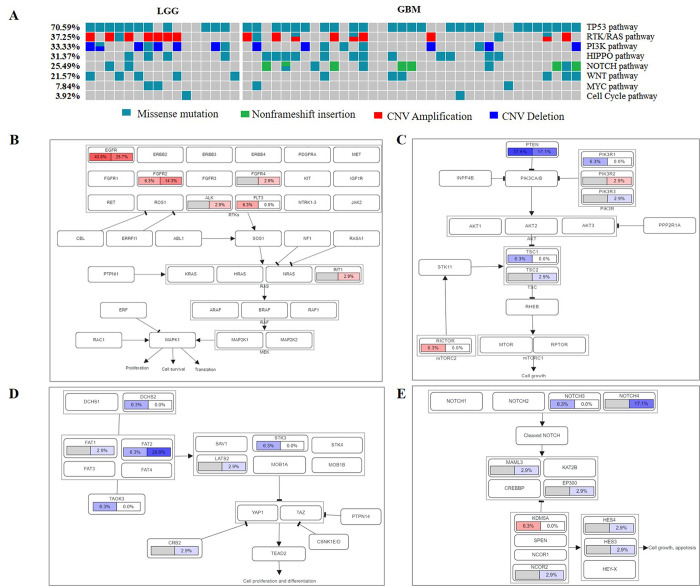
Fig 5. The frequencies of oncogenic signaling pathways altered in patients with gliomas.
(A) The frequencies of oncogenic signaling pathways altered in gliomas. (B) RTK/RAS pathway. (C) PI3K pathway. (D) HIPPO pathway. (E) NOTCH pathway. Pathways were labeled with LGG on the left whereas GBM on the right. Red represents an oncogene while blue represents a tumor suppressor gene.

