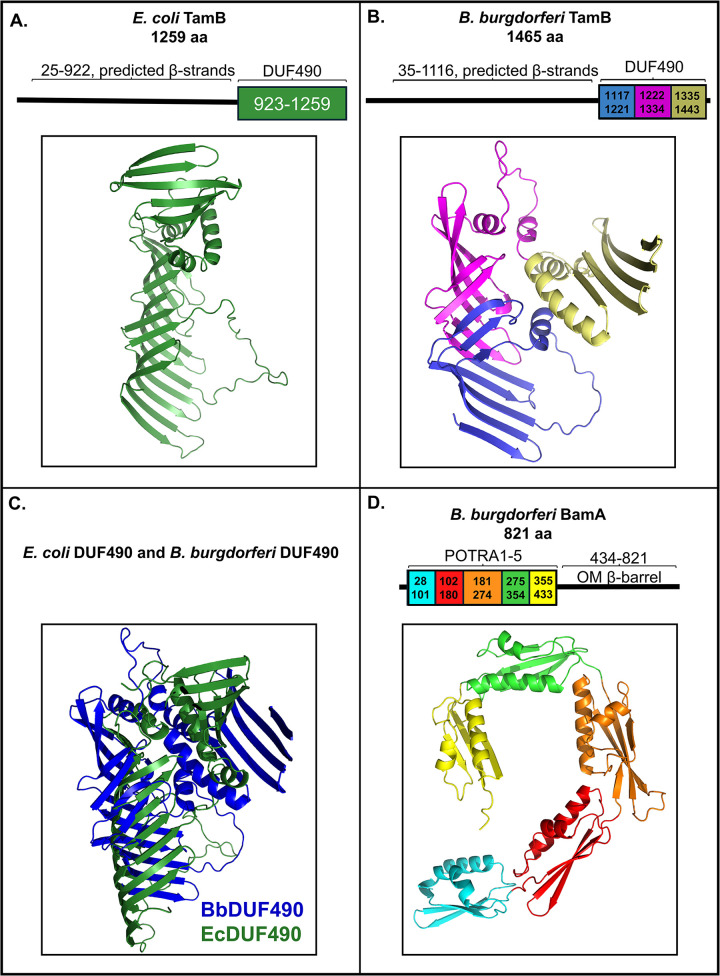
Fig 1. Structural models of DUF490 and POTRA domains.
The colored regions under brackets were subjected to AlphaFold v2.0 modeling under default settings. All structures are oriented with the N-terminus down. A. AlphaFold v2.0 model of E. coli DUF490 (aa 923–1259 of TamB). B. AlphaFold v2.0 model of B. burgdorferi DUF490 (aa 1117–1443 of TamB) colorized to depict experimental segments dissected in this study: Segment 1 (aa 1117–1221) in blue, Segment 2 (aa 1222–1334) in magenta, and Segment 3 (aa 1335–1443) in wheat. C. AlphaFold v2.0 models of the DUF490 domains from B. burgdorferi (in blue) and E. coli (in green) superimposed. D. AlphaFold v2.0 model of B. burgdorferi BamA POTRA domains 1–5 colorized to depict individual POTRA domains: POTRA1 (aa 28–101) in cyan, POTRA2 (aa 102–180) in red, POTRA3 (aa 181–274) in orange, POTRA4 (aa 275–354) in green, and POTRA5 (aa 355–433) in yellow.

