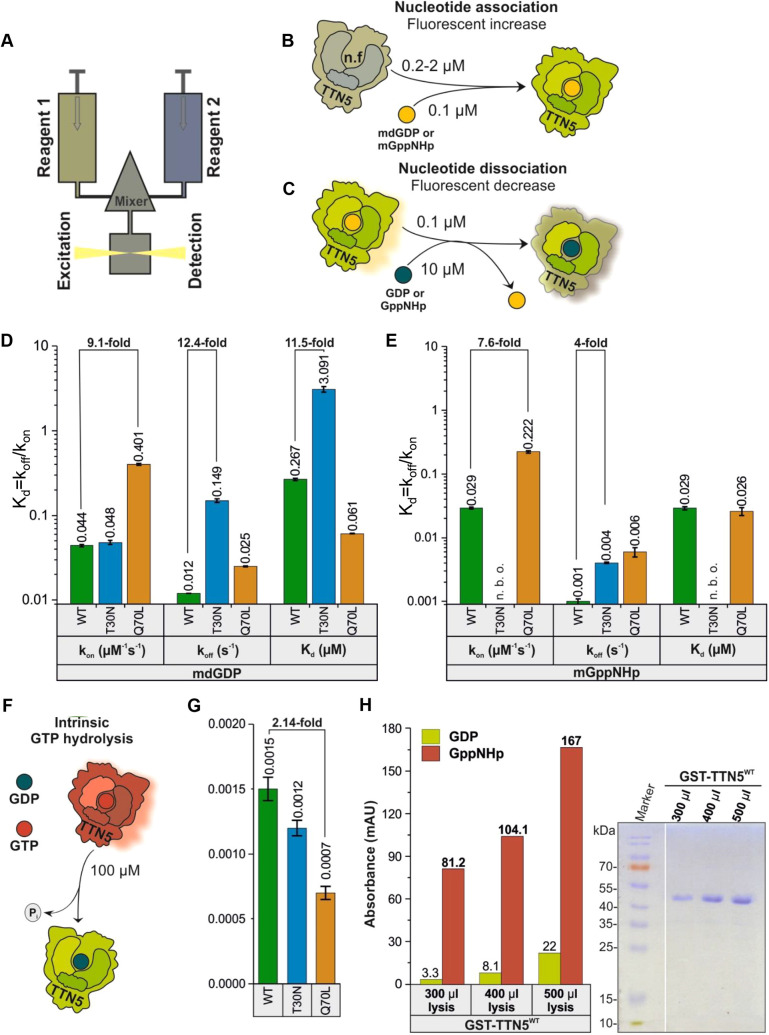
Fig. 2.
Biochemical properties of TTN5 suggest its presence in a GTP-loaded active form in cells. (A) Schematic illustration of the stopped-flow fluorescence device for monitoring nucleotide-binding kinetics of heterologously expressed and purified TTN5 protein (Fig. S2A–D). It consists of two motorized thermostated syringes, a mixing chamber and a fluorescence detector. Two different reagents, 1 and 2, with one containing a fluorescent reporter group (mdGDP or mGppNHp to mimic GDP and GTP) are rapidly mixed and transferred to a fluorescence detection cell. (B) Schematic illustration of nucleotide association. Nucleotide-free TTN5 (for preparation see Fig. S2E) was rapidly mixed with mdGDP. A fluorescence increase is expected upon association of mdGDP with TTN5. Similar measurements were performed with mGppNHp. (C) Schematic illustration of intrinsic nucleotide dissociation. mdGDP-bound TTN5 is mixed with a molar excess of GDP. A fluorescence decrease is expected upon mdGDP dissociation from TTN5 and binding of free unlabeled GDP. Similar measurements were performed with mGppNHp. (D,E) Kinetics of association and dissociation of fluorescent nucleotides mdGDP (D) or mGppNHp (E) with TTN5 proteins (WT, TTN5T30N, TTN5Q70L). Association rate constants (kon in µM−1s−1) were determined from the plot of increasing observed rate constants (kobs in s−1) against corresponding TTN5 protein concentrations (as denoted in A,B; for full data, see Figs S3A–F, S4A–E). Intrinsic dissociation rates (koff in s−1) were determined from the plot of fluorescent decrease upon exchange from mdGDP-bound or mGppNHp-bound TTN5 to GDP-bound TTN5 (as denoted in A,C; for full data, see Figs S3G–I, S4F–H). The nucleotide affinity (dissociation constant Kd in µM) of the corresponding TTN5 proteins was calculated from the koff/kon ratio. When mixing mGppNHp with nucleotide-free TTN5T30N, no binding was observed (n.b.o.) under these experimental conditions. kon and koff values presented as bar graphs are calculated from the average of four to six measurements and presented as mean±s.d. (F,G) GTP hydrolysis of TTN5 proteins determined by HPLC. (F) Schematic illustration of GTP hydrolysis measurement. (G) GTP-bound TTN5 proteins incubated at different time points before injecting them on a reversed-phase HPLC system. Evaluated data (Fig. S5) resulted in determination of GTP hydrolysis rates (kcat in s−1). Each bar represents the kcat value obtained from a single experiment per condition, comprising six data points. Error bars indicate the standard errors of the fitted values as determined by Origin software. (H) TTN5 accumulation in a GTP-loaded form by HPLC values and Coomassie Blue-stained SDS-PAGE. GST–TTN5WT (46.5 kDa) was purified from bacterial cell lysates at three different volumes in the presence of free GppNHp. Presence of much higher amounts of GppNHp-bound versus GDP-bound GST-TTN5 protein indicates that TTN5 rapidly exchanged bound nucleotide and accumulated in this state. This was a confirmatory experiment performed once.

