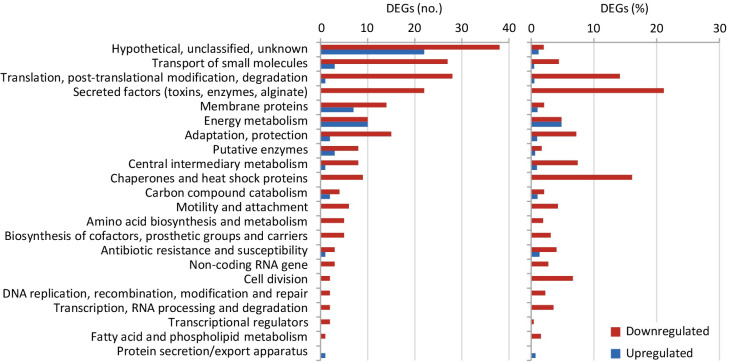
Fig 3.
Functional analysis of differentially expressed genes (DEGs). Number (left panel) and relative percentage (right panel) of downregulated and upregulated genes (red and green bars, respectively) in the apaH mutant compared to PAO1 in the PseudoCAP functional categories listed on the left. Only DEGs with a fold change ≥ ± 4 were considered (S1 Table).

