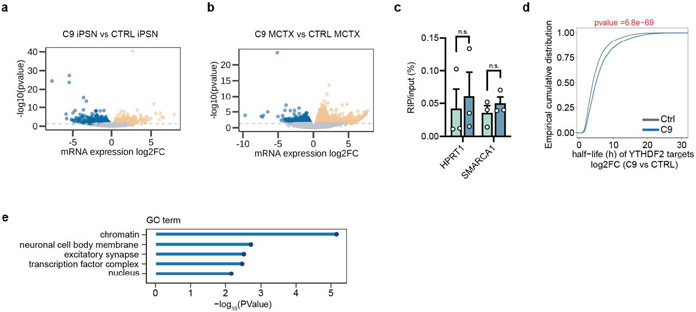
Extended Data Fig. 6: The impact of m6A hypomethylation on mRNAs.
a,b, Volcano plot of differentially expressed genes in C9ORF72-ALS/FTD compared to the control, in iPSNs (a) and postmortem motor cortex (b). Genes with significant changes are represented by orange (upregulated in C9) and blue (downregulated in C9) dots. iPSNs: n=4 individual lines per group, 1212 upregulated vs 1168 downregulated. Motor cortex: n=3 individual tissue samples per group, 1892 upregulated versus 1239 downregulated. p<0.05, two-sided. c, YTHDF2-RIP qPCR of selected YTHDF2 mRNA targets identified from the non-YTHDF2 bound RNAs. HPRT1 and SMARCA1 mRNAs have no m6A modification according to the MeRIP-seq results. Points represent individual iPSN lines. n=3 in each group. Data are mean ± s.e.m. p=0.7047 and p=0.4001, respectively, by two-tailed t test. d, Cumulative distribution demonstrating the half-life of YTHDF2 targets between control and C9ORF72-ALS/FTD iPSNs. p-value was calculated by a two-tailed non-parametric Wilcoxon-Matt-Whitney test. e, Gene Ontology (GO) enrichment analysis of hypomethylated YTHDF2 binding targets which also showed significantly increased half-life.

