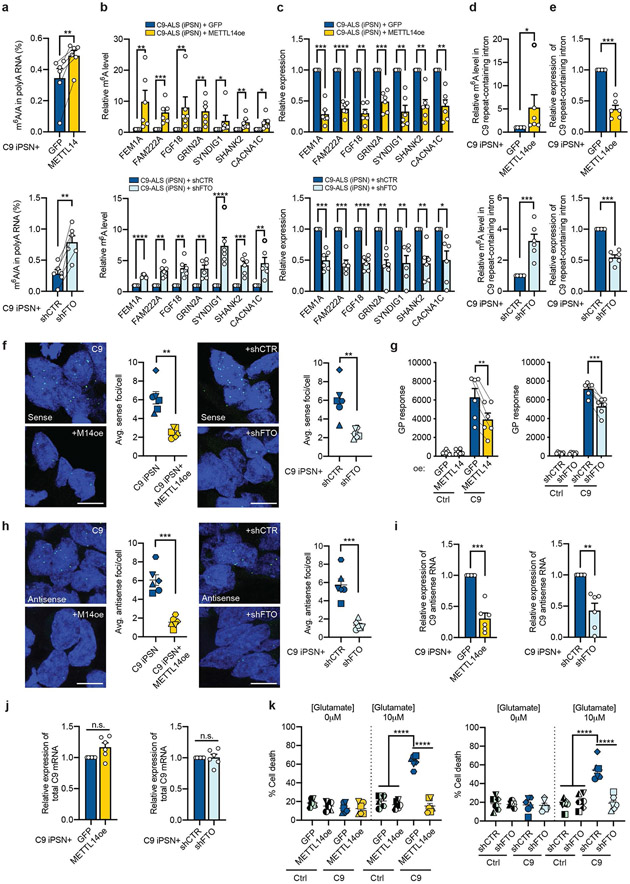
Fig. 6: m6A restoration rescues disease-related phenotypes in C9ORF72-ALS/FTD patient iPSNs.
C9ORF72-ALS/FTD iPSNs were infected with lentivirus overexpressing METTL14 or GFP as negative control, or with lentivirus expressing FTO shRNA or non-targeting control shRNA. Data are from six patient iPSN lines. Points represent individual lines. a, UHPLC-QQQ-MS/MS quantification of the m6A/A ratio in poly-A RNAs from iPSNs with METTL14 overexpression (Top) or FTO knockdown (Bottom). **p=0.0043 and 0.0012, respectively, by paired two-tailed t test. b, The m6A level of representative mRNA targets was examined by MeRIP coupled with RT-qPCR. (Top) Overexpression of METTL14. (Bottom) Knockdown of FTO. *p<0.05, **p<0.01, ***p<0.001, ****p<0.0001, by paired two-tailed t test. c, The RNA expression of the targets was examined by RT-qPCR. (Top) Overexpression of METTL14. (Bottom) Knockdown of FTO. *p<0.05, **p<0.01, ***p<0.001, ****p<0.0001, by paired two-tailed t test. d, Relative m6A level in the C9 repeat-containing intron was measured by MeRIP-RT-qPCR. *p=0.0319, ***p=0.0005, by paired two-tailed t test. e, Relative RNA expression of C9 repeat-containing intron was measured by RT-qPCR. ***p=0.0001 by paired two-tailed t test. f,h, Representative images and quantification of FISH experiment to examine the sense (f) and antisense (h) RNA foci changes in C9ORF72-ALS/FTD iPSNs upon METTL14 overexpression (Left) or FTO knockdown (Right). Scale bar, 10μm. **p=0.0044 and 0.0058, respectively (f); ***p=0.0001 and 0.0009, respectively (h), by paired two-tailed t test. g, Poly-GP protein level was measured by ELISA. (Left) Overexpression of METTL14. (Right) Knockdown of FTO. **p=0.0024, ***p=0.001, by paired two-tailed t test. i, RT-qPCR of endogenous antisense repeat RNA expression in C9ORF72-ALS/FTD iPSNs upon METTL14 overexpression (Left) or FTO knockdown (Right). **p=0.0046, ***p=0.0005, by paired two-tailed t test. j, RT-qPCR of total C9 mRNA expression in C9ORF72-ALS/FTD iPSNs upon METTL14 overexpression (Left) or FTO knockdown (Right). p=0.0617 and 0.9238, respectively. k, Glutamate-induced excitotoxicity in control and C9ORF72-ALS/FTD iPSNs overexpressing GFP vs METTL14, or expressing control shRNA vs FTO shRNA. Different shapes represent different iPSN lines from 6 control and 6 patients. ****p<0.0001 by paired two-tailed t test. (a-k) Data are mean ± s.e.m. Points represent individual cell lines.

