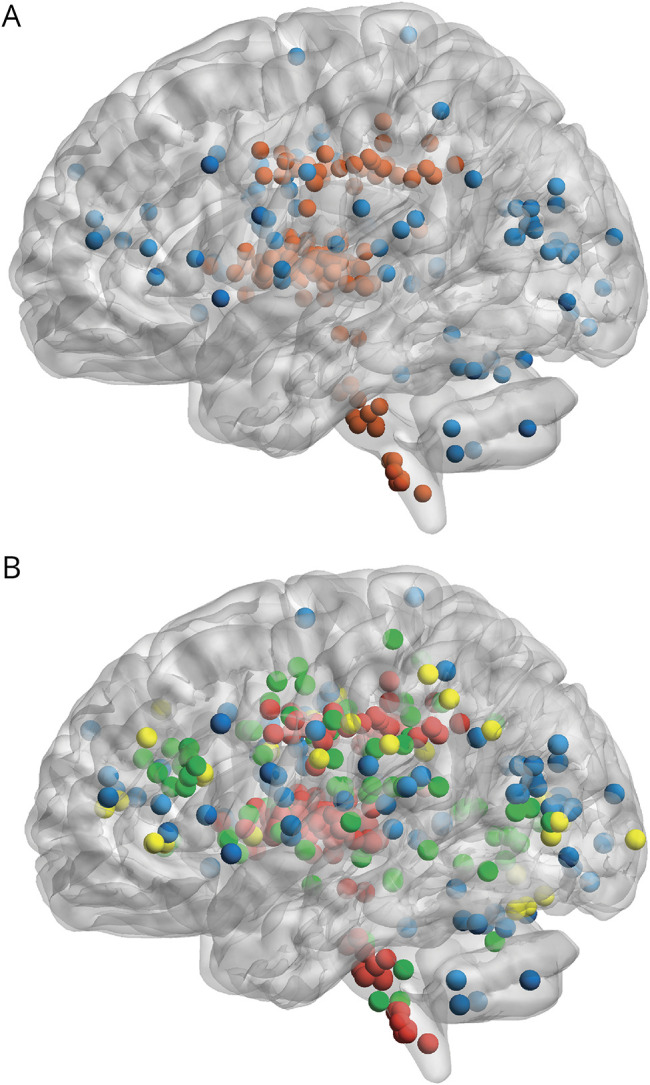
Figure 1. Index and Incident Infarct Locations.

(A) Index infarct locations across the study population showing population enriched for lacunar stroke. Red = small subcortical; blue = cortical. (B) Incident infarcts superimposed, n = 117, showing small subcortical infarcts accounting for the majority. Green = incident small subcortical infarct; yellow = incident cortical infarct; red = index small subcortical infarct; blue = index cortical infarct. Markers are a visual representation of incident infarct lesion location but do not represent lesion volume. Created using BrainNetViewer v1.7 and MRIcron, based on visual rating locations.
