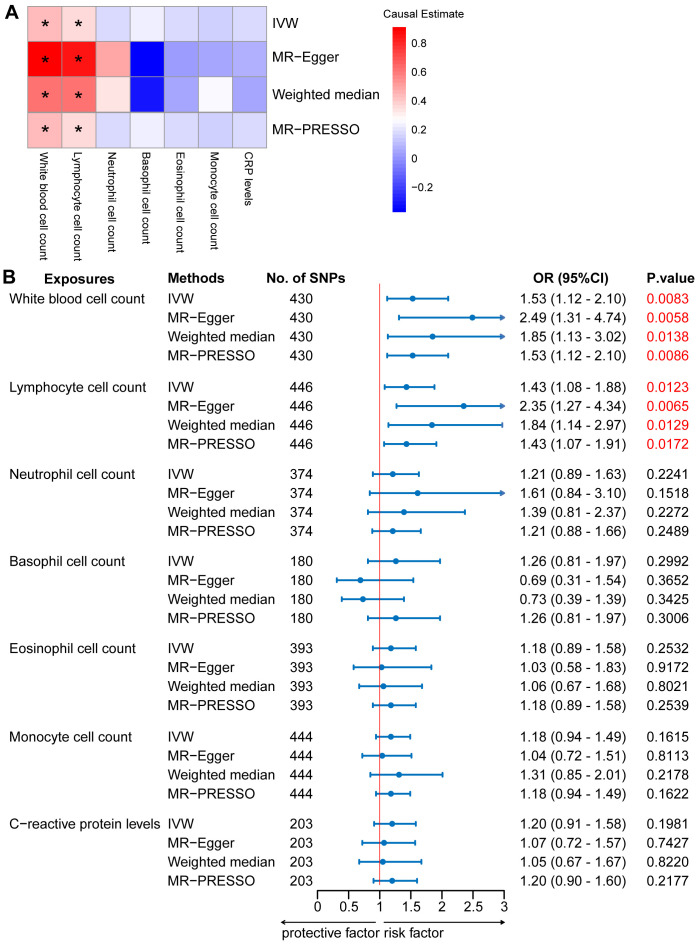
Figure 2.
Mendelian randomization (MR) analyses testing the effects of 6 immune cell subpopulation counts and CRP levels on IgAN. (A) Results obtained using four MR approaches are presented as a heat map showing causal estimates (beta). *P <0.05 for a particular MR methods. (B) MR estimates of the association between immune cell subpopulation counts and CRP levels and risk of IgAN. IVW, Inverse Variance Weighted; MR-Egger, Mendelian randomization-Egger; MR-PRESSO, Mendelian Randomization Pleiotropy Residual Sum and Outlier; OR, Odds Ratio; CI, Confidence Interval.

