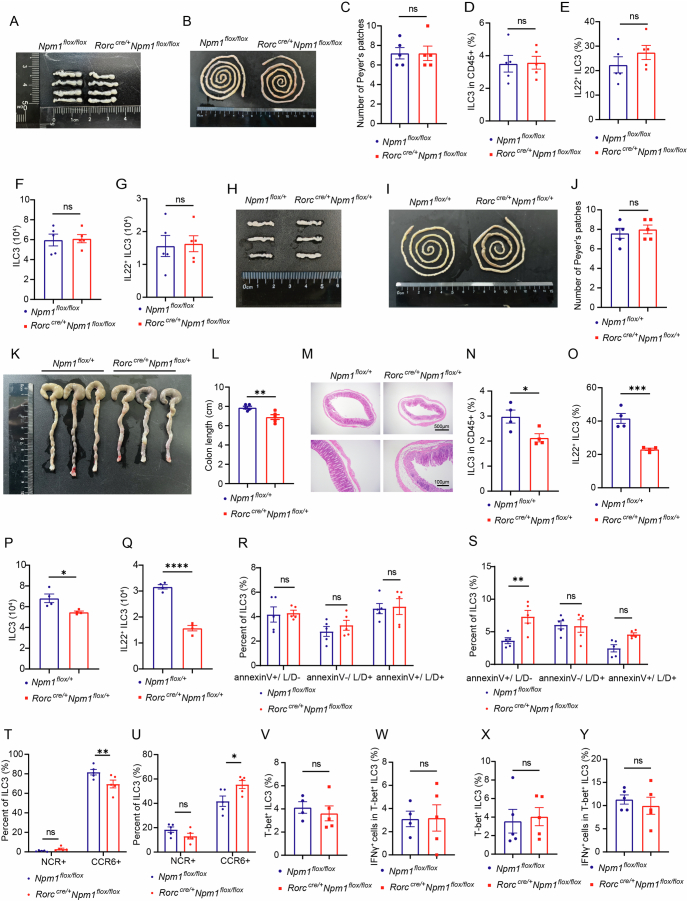
Extended Data Fig. 5. NPM1 is required for maintaining the frequency and function of colonic ILC3s.
(a) Images of mesenteric lymph nodes from Npm1flox/flox and Rorccre/+Npm1flox/flox mice (n = 4 individual mice). (b,c) Representative images of Peyer’s patches from Npm1flox/flox and Rorccre/+Npm1flox/flox mice in steady state. The number of Peyer’s patches (c) was analyzed (n = 5 individual mice). (d–g) ILC3s in LPLs of Npm1flox/flox and Rorccre/+Npm1flox/flox mice under steady-state. (d) Proportion of ILC3s in Lin− cells. (e) Proportion of IL-22+ ILC3s in the total ILC3 population. Number of ILC3s (f) and IL-22+ ILC3s (g) are depicted (n = 5 individual mice). (h) Images of mesenteric lymph nodes from Npm1flox/flox and Rorccre/+Npm1flox/flox mice (n = 3 individual mice). (i,j) Representative images of Peyer’s patches from Npm1flox/+ and Rorccre/+Npm1flox/+ mice in steady state (i). The number of Peyer’s patches (j) was analyzed (n = 5 individual mice). (k–m) Npm1flox/+and Rorccre/+Npm1flox/+mice were administered 2.5% DSS for 7 days followed by 3 days of recovery. Representative images of colons (k), colon length (l) and colon histopathology on day 10 (m) are presented. (n = 4 individual mice). Scale bars: 500 μm (up), 100 μm (down). (n–q) ILC3s in LPLs of Npm1flox/+ and Rorccre/+Npm1flox/+mice with colitis. (n) Proportion of ILC3s in Lin− cells. (o) Proportion of IL-22+ ILC3s in the total ILC3 population. Number of ILC3s (p) and IL-22+ ILC3s (q) are provided (n = 4 individual mice). (r,s) Apoptotic percentage of ILC3s in LPLs from Npm1flox/flox and Rorccre/+Npm1flox/flox mice was detected by Annexin V staining under steady-state (r) and during DSS-induced colitis (s) (n = 5 individual mice). (t,u) Proportion of NCR+ ILC3s and CCR6+ ILC3s in total ILC3s from colon of Npm1flox/flox and Rorccre/+Npm1flox/flox mice under steady-state (t) and during DSS-induced colitis (u) (n = 5 individual mice). (v–y) Proportion of T-bet+ ILC3s in LPLs and IFNγ+ cells in T-bet+ ILC3s from Npm1flox/flox and Rorccre/+Npm1flox/flox mice under steady-state (v,w) (n = 4 individual mice) and during DSS-induced colitis (x,y) (n = 5 individual mice). Data are representative of two independent experiments, shown as the means ± s.e.m., and statistical significance was determined by two-tailed unpaired Student’s t-test (c–g, j, l, n–q and v–y) and two-way ANOVA (r–u) (*p < 0.05, **p < 0.01, ***p < 0.001, ****p < 0.0001).

