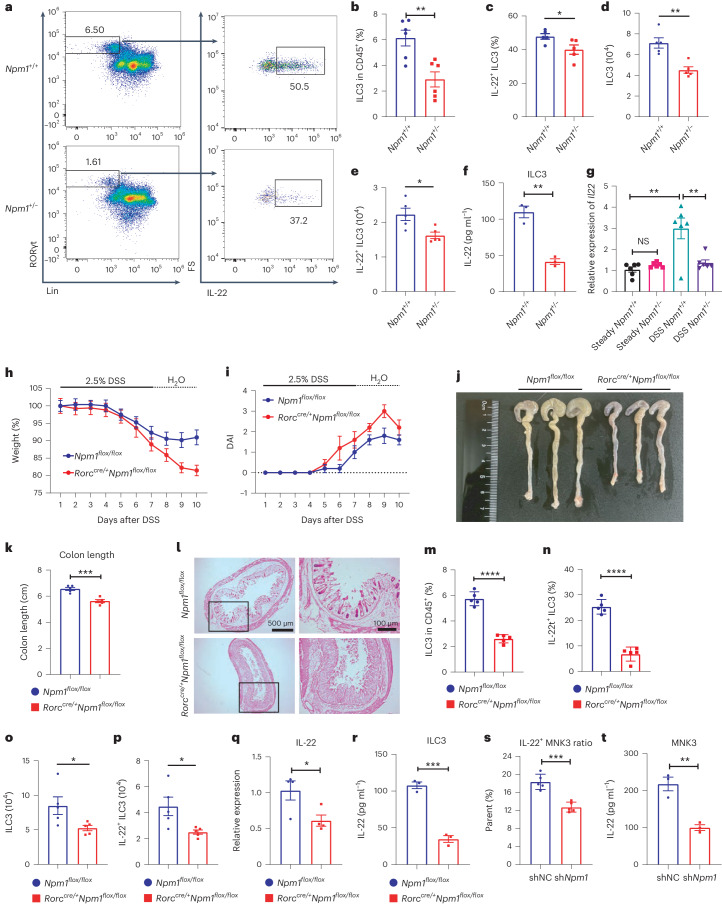
Fig. 2. NPM1 is required for maintaining the frequency and function of colonic ILC3s.
a, Colon LPLs were isolated from Npm1+/+ and Npm1+/− mice at day 5 of administration of 2.5% DSS. Analysis of ILC3s (live CD45+Lin−RORγt+ cells) and IL-22-producing ILC3s (live CD45+Lin−RORγt+IL-22+ cells) by flow cytometry. Numbers indicate percentages of cells in each outlined region. b,c, The proportion of CD45+ cells that are ILC3s (b; n = 6 individual mice) and the proportion of IL-22+ ILC3s in the total ILC3 population (c; n = 5 individual mice) in LPLs of Npm1+/+ and Npm1+/− mice after DSS administration are shown. d,e, Number of ILC3s (d) and IL-22+ ILC3s (e) in LPLs of Npm1+/+ and Npm1+/− mice after DSS administration are depicted (n = 5 individual mice). f, ILC3s, isolated by cell sorting from LPLs of Npm1+/+ and Npm1+/− mice after DSS administration, were analyzed by ELISA for IL-22 (n = 3 individual mice). g, Relative mRNA abundance of Il22 in ILC3s, isolated by cell sorting from the LPL of Npm1+/+ and Npm1+/− mice exposed to 2.5% DSS or water (steady state), was analyzed. The results are shown relative to the amount in cells from Npm1+/+ mice exposed to water (steady state; n = 6 individual mice). h–l, Npm1flox/flox and Rorccre/+Npm1flox/flox mice were administered 2.5% DSS for 7 d followed by 3 d of recovery. Body weight (h), DAI (i), colon length (j,k) and colon histopathology on day 10 (l) were analyzed (n = 5 individual mice). Scale bars = 500 μm (left) and 100 μm (right). m,n, LPLs were isolated from Npm1flox/flox and Rorccre/+Npm1flox/flox mice after 5 days of administration of 2.5% DSS (n = 5 individual mice). The proportion of CD45+ cells that are ILC3s (m) and the proportion of IL-22+ ILC3s in the total ILC3 population (n) are shown. o,p, The number of ILC3s (o) and IL-22+ ILC3s (p) in LPLs of Npm1flox/flox and Rorccre/+Npm1flox/flox mice after DSS administration are depicted (n = 5 individual mice). q, Relative mRNA abundance of Il22 in ILC3s, isolated by cell sorting from the LPL of Npm1flox/flox and Rorccre/+Npm1flox/flox mice at day 5 of administration of 2.5% DSS was analyzed (n = 4 individual mice). r, ILC3s, isolated by cell sorting from LPLs of Npm1flox/flox and Rorccre/+Npm1flox/flox, were analyzed by ELISA for IL-22 (n = 3 individual mice). s,t, IL-22 production by MNK3 cells after stimulation with IL-1β and IL-23 in vitro by flow cytometry (s; n = 5 individual mice) and by ELISA (t; n = 3 individual mice). Data in b–g, k and m–t are representative of two independent experiments, shown as the means ± s.e.m., and statistical significance was determined by two-tailed unpaired Student’s t test (*P < 0.05, **P < 0.01, ***P < 0.001 and ****P < 0.0001). LPLs, lamina propria leukocytes.

