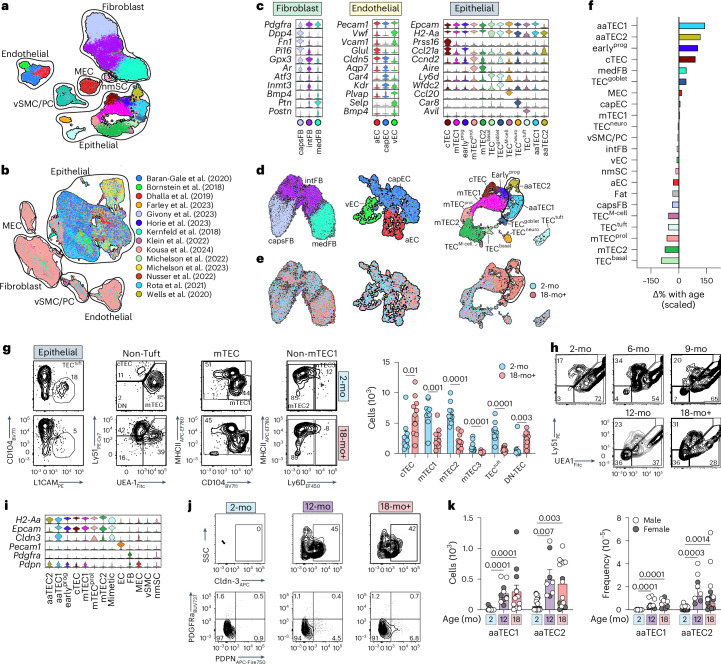
Fig. 1. Emergence of atypical epithelial populations with age.
a, Uniform Manifold Approximation and Projection (UMAP) of 22,932 CD45− thymic cells from 2-mo and 18-mo female C57BL/6 mice, annotated by cell type subset and outlined by cell compartment (epithelial; fibroblast; endothelial; MEC; vSMC/PC; nmSC). b, ThymoSight integration of public data for murine nonhematopoietic thymic stromal cells, including our own dataset (n = 297,988) annotated by publication source and outlined by cell type and compartment. c, Violin plots highlighting key genes marking individual subsets within individual structural compartments (fibroblast, endothelium and epithelium). d,e, UMAPs of individual structural compartments color-coded by cell type subset (d) and age cohort (e). nEC = 1,661; nFB = 13,240; nTEC = 6,175. f, Scaled change in frequency for each individual structural cell subset with age. g, Gating strategy and quantities for cell populations within the epithelial lineage (based on previous work6) in 2-mo (n = 10) and 18-mo (n = 10) mice. First, based on a CD45−EpCAM+ parent gate, tuft cells were identified by expression of L1CAM, then all other TECs were assessed for expression of conventional TEC markers UEA1 and Ly51. Within the UEA1hiLy51lo mTEC population CD104+MHCIIlo cells were identified as mTEC1. Cells that were deemed as non-mTEC1 were then fractionated based on MHCII and Ly6D. h, Concatenated flow cytometry plots and graphs highlighting the frequency of Ly51−UEA1− (DN-TECs) across lifespan (gated on CD45−EpCAM+MHCII+ cells). i, Violin plots of aaTEC1 and aaTEC2 novel markers. j,k, Flow cytometry plots (j) and quantities (k) for aaTEC1 and aaTEC2 populations in 2-mo (n = 15), 12-mo (n = 10) or 18-mo (n = 13) male and female C57BL/6 mice. Summary data represent mean ± s.e.m.; each dot represents an individual biological replicate. Statistics were generated using a two-tailed Mann–Whitney test comparing within individual subsets (g) or Kruskal–Wallis (k) test with Dunn’s correction.

