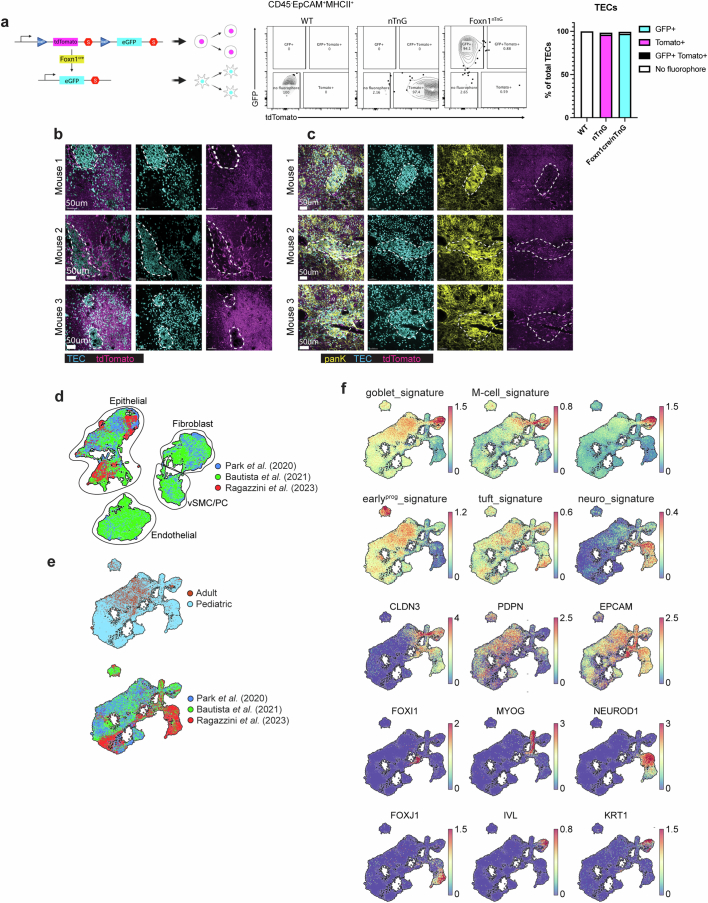
Extended Data Fig. 5. Validation of aaTEC identification and imaging.
a, Generation of Foxn1nTnG mice. ROSAnT-nG (nT/nG) mice73 were intercrossed with Foxn1Cre mice74. Representative flow cytometric plots of TEC from 11 weeks old WT, nT/nG and Foxn1nTnG show specific detection of GFP in nearly all TEC only in the latter strain. Quantification of the relative proportions of TEC expressing the reporters are shown in the bar graph on the right (n = 2 to 3 from 2 experiments). b, Representative confocal images of thymic sections from 12-mo Foxn1nTnG mice with high-density TECs located in peri-medullary region. c, Representative confocal images of thymic sections from 12-mo Foxn1nTnG mice stained with anti-pan-keratin, with high-density TEC regions highlighted. d, UMAPs integrating all human CD45− non-hematopoietic cells from published datasets9,19,20 (ThymoSight) annotated by age and dataset (n = 115,536). e, UMAPs integrating all human thymic epithelial cells from public datasets9,19,20 (ThymoSight) annotated by age and dataset (n = 40,144). f, Signatures of our mouse epithelial cell subsets (Supplementary Table 3), including aaTEC, overlaid onto the integrated human TEC data derived from9,19,20.

