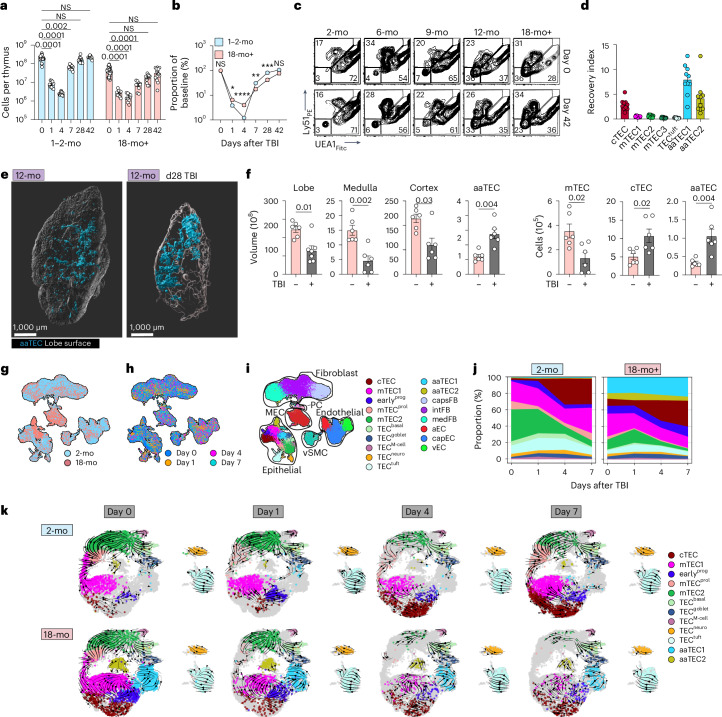
Fig. 5. Aging negatively impacts thymic regeneration.
a,b, 2-mo or 18-mo female C57BL/6 mice were given a sublethal dose of TBI (550 cGy) and the thymus was assessed at the indicated time points (n = 30, 2-mo day 0; 10, 2-mo day 1; 10, 2-mo day 4; 10, 2-mo day 7; 10, 2-mo day 28; 10, 2-mo day 42; and 35, 18-mo day 0; 10, 18-mo day 1; 10, 18-mo day 4; 10, 18-mo day 7; 10, 18-mo day 28; 15, 18-mo day 42). Total thymic cellularity (a). Proportion of total thymic cellularity at the indicated time points as a function of steady-state age-matched cellularity (b). c, Flow cytometry plots (gated on CD45−EpCAM+) showing DN-TECs at day 42 after TBI in C57BL/6 mice at the indicated ages. d, Depletion and recovery of indicated populations were quantified by flow cytometry over the first 7 days after TBI in 2-mo or 18-mo mice and area under the curve was calculated (Extended Data Fig. 9b). An aging index was generated by calculating the ratio of aged to young AUC for each indicated population (n = 10 per cell type). e, Whole-tissue imaging of 12-mo male Foxn1nTnG mice at baseline or 28 days after TBI (550 cGy). f, Total volume and volume of cortex, medulla and aaTEC regions, as well as the number of cTECs, mTECs and aaTECs of the thymic right lobe. g–j, scRNA-seq was performed on CD45− cells isolated from 2-mo or 18-mo thymus at baseline (day 0) and days 1, 4 and 7 after TBI. UMAP of 81,241 CD45− cells annotated by age cohort (g), day after TBI (h) or structural cell subset mapped from Fig. 1c and Extended Data Fig. 10a (i). j Associated frequency analysis of all TEC subsets after TBI within each age cohort. k, RNA velocity analysis on all TEC subsets at days 0, 1, 4 and 7 after TBI in 2-mo or 18-mo mice. Summary data represent mean ± s.e.m. and each dot represents an individual biological replicate. Statistics were generated using the Kruskal–Wallis test with Dunn’s correction (a,d) and two-tailed Mann–Whitney test (b,f). For b, statistics represent a comparison of 2-mo to 18-mo mice within each time point. *P = 0.02; **P = 0.004; ***P = 0.002; ****P < 0.0001.

