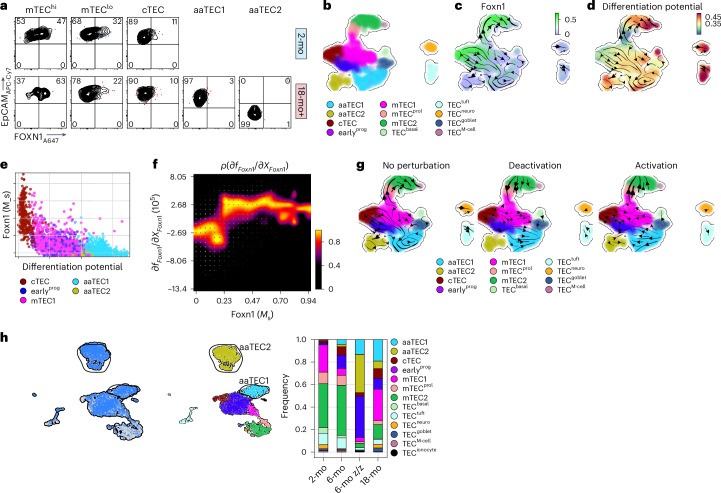
Fig. 7. FOXN1 loss of function accelerates aaTEC emergence with age.
a, FOXN1 expression across TEC subsets by flow cytometry. b–d, UMAP of 18-mo TEC data at steady state, color-coded for TEC subset (b), Foxn1 expression (c) and differentiation potential (d) with projected RNA velocity data. e, Scatter-plot of differentiation potential (d) versus Foxn1 expression levels color-coded by subset annotation. f, Response heatmap showing the RNA Jacobian element for Foxn1 self-induction (dfFoxn1/dXFoxn1) versus the Foxn1 expression (Foxn1 (Ms)). g, In silico perturbation analysis of Foxn1 in the 18-mo epithelium at steady state and accompanied cell fate diversions. Velocity arrows in UMAPs show cell fate directionality in the unperturbed dataset (left) and after in silico suppression (middle) or induction (right) of Foxn1. h, scRNA-seq was performed on CD45− cells from 6-mo Foxn1Z/Z mice and controls. UMAPs of 3,594 cells color-coded by sample and mapped to our TEC subsets.

