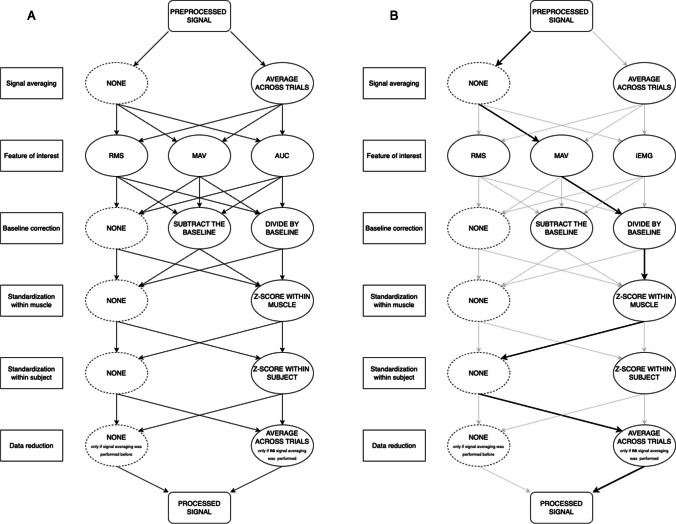
Fig. 2.
A A diagram of processing steps and their possible sequences. All pipelines included a data averaging step, either during signal averaging (first step) or during data reduction (last step), but the data were never averaged twice. B An example pipeline, including (1) no signal averaging in the first step, (2) mean absolute value as a feature of interest, (3) division by baseline as a baseline correction, (4) z-scoring within each muscle within participants, (5) no z-scoring between muscles within participants, and (6) averaging across trials in the data reduction step. It corresponds to pipeline Aa_MAV_Bd_Ms_Sn (see Table 1 in Supplementary materials and Naming the processing pipelines)

