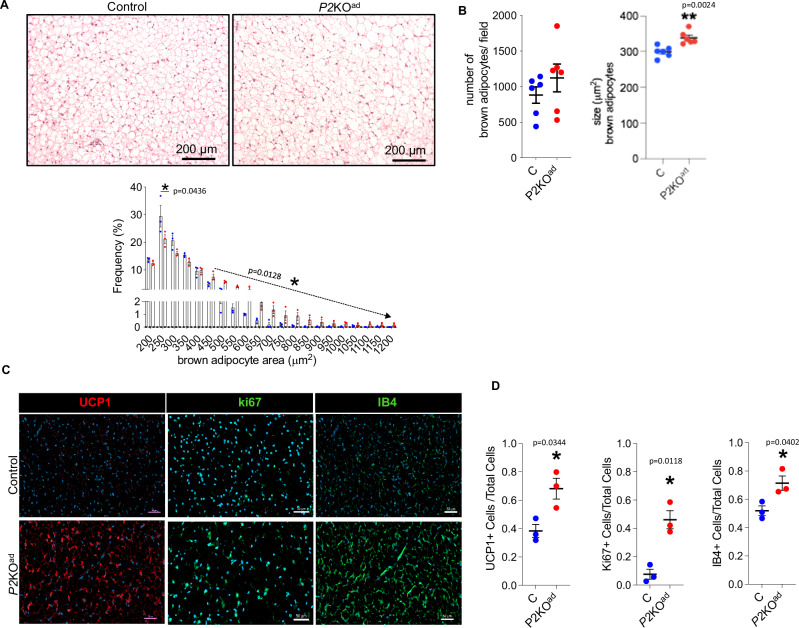
Fig. 4. P2KOad male mice maintain functional BAT at thermoneutrality.
A H&E staining of BAT and frequency distribution of small and large adipocytes (n = 3/group, biological replicates). B Quantification graphs of number and size of brown adipocytes in P2KOad (red) and control littermates (blue). The adipocyte number/size is per microscopic field (total of 6 fields per animal analysed, n = 6/group, biological replicates). C Immunofluorescence images (scale bars 50 µm) and D quantification graphs of BAT stained for UCP1+ (red) and ki67+ and IB4+ (green) cells at TN (n = 3/group, biological replicates). Nuclei stained with DAPI (blue). Data are presented as mean + /− SEM. *P < 0.05, by Student t test (two-tailed). A Source data are provided as a Source Data file.

