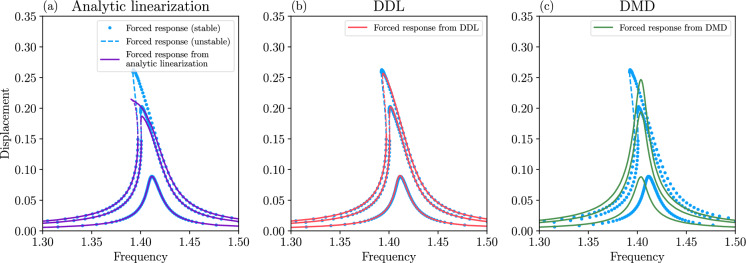
Fig. 6.
Periodic response of the Duffing oscillator under the forcing (63). The three distinctly colored forced response curves correspond to . a Actual nonlinear forced response from numerical continuation (blue) and prediction for it from analytic linearization (purple) b forced response predictions from DDL (red) c forced response predictions from DMD (green). The training data for panels b and c is the same unforced trajectory data set as the one used in Fig. 5. (Color figure online)

