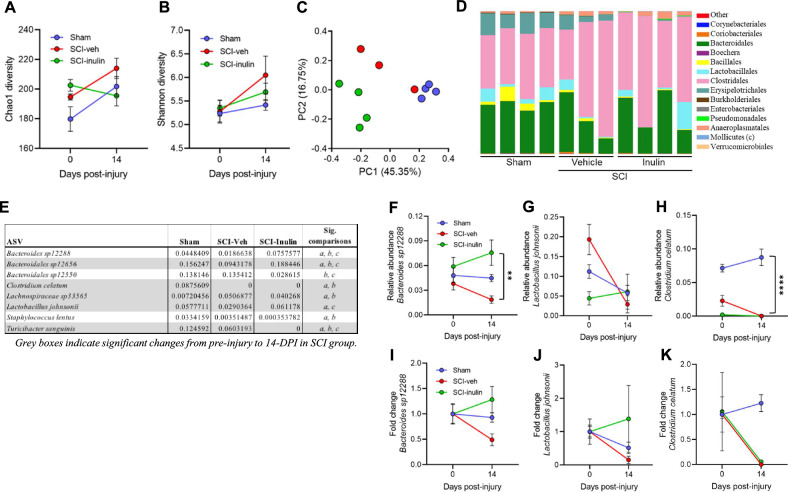
Fig. 2. SCI-triggered dysbiosis is prevented by inulin.
Pre-surgery to 14-dpi changes in fecal microbiome in male mice. Chao1(A) and Shannon (B) alpha diversity measures. C Bray–Curtis principal component analysis (PCA) plot. D Order level microbiome composition plot at 14-dpi. E Table highlighting the mean relative abundance of bacterial taxa that differ between experimental groups at 1% FDR, where gray boxes indicate significant changes from pre-injury to 14-dpi in SCI-veh group, and “a, b, & c” indicate significant differences between groups at endpoint. F–K Progressive changes in select taxa represented as relative abundance (F–H) and as proportion of pre-injury abundance (I–K) for Bacteroides sp12288 (F, I), Lactobacillus johnsonii (G, J), and Clostridium celatum (H, K). Asterisks in (F) indicate significant difference between SCI-veh and SCI-inulin groups at 14-dpi. Asterisks in (H) indicate significant difference between sham and both SCI groups. Each circle represents within group mean, excluding C where each circle represents individuals. N = 3–4. **P < 0.01, ****P < 0.0001. Data are shown as mean ± SEM and compared by repeated measures 2-way ANOVA with post-hoc Sidak’s test (A, B) or Tukey’s test (F–K) and by 1% FDR (for E).

