
Fig. 3.
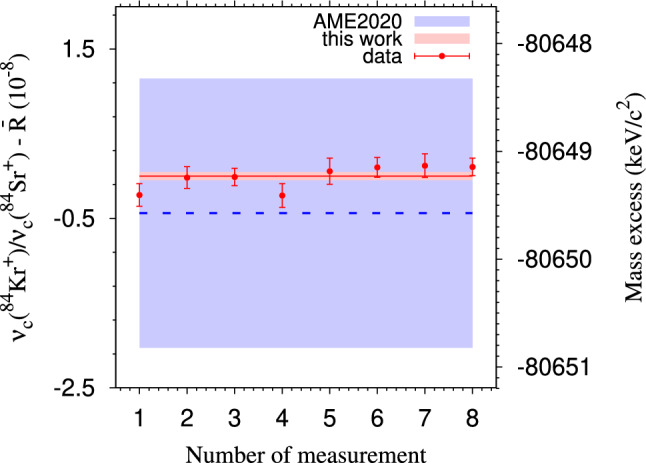
The deviation (left axis) of the individually measured cyclotron frequency ratios (()/()) from the final ratio value and (right axis)) mass-excess values in this work compared to values adopted from AME2020 [28, 50]. The red points, accompanied by uncertainties, represent individual data obtained with the PI-ICR method in eight distinct time slots. The solid red line illustrates the weighted average value from this work, = 1.000 022 902 36(48), and its 1 uncertainty band is shaded in red. The dashed blue line represents the difference between the new value in this work and the one referred to in AME2020, with its 1 uncertainty area shaded in blue