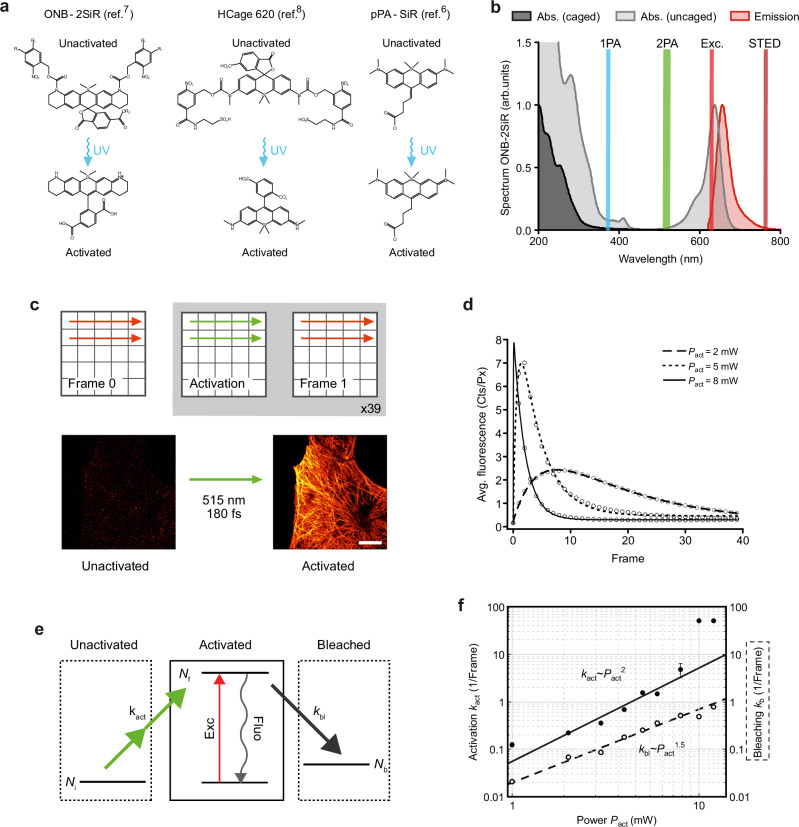
Fig. 2. The silicon rhodamine dyes ONB-2SiR, HCage 620 and pPA-SiR can be efficiently photoactivated by a two-photon process with 515 nm light.
a Chemical structures of ONB-2SiR, HCage 620 and pPA-SiR before (upper row) and after activation (lower row). b Absorption spectrum of the unactivated caged form (dark gray), and absorption and emission spectra of the activated uncaged form (light gray, red) for ONB-2SiR. The green and blue lines centered at 515 nm and 375 nm indicate the laser light employed for the 2PA and 1PA, respectively. Exc., STED: excitation and STED wavelengths. c Experimental sequence: Frame 0: reference scan with the excitation beam alone to detect residual background fluorescence of unactivated dye; Activation: scan with 515-nm femtosecond laser to uncage (activate) fluorophores; Frame 1: readout of the fluorescence signal with the excitation beam. Below: the images of tubulin before and after activation (10 × 10 µm2, 256 × 256 pxl2). Scale bar: 10 µm. All beams were diffraction-limited, the activation and readout sequence were repeated 39 times. d Average fluorescence signal vs. number of consecutive readout frames after activation scans for different activation powers Pact. For low activation power, the signal initially increases. Later, photobleaching is dominant, resulting in a signal decrease. e A 3-level system, which takes the activation and bleaching process into account, is sufficient to describe the observed signal behavior (curves in d). f Activation and bleaching rate extracted from fits to the data in d as a function of activation power. The power scaling indicates a two-photon process for activation, and more complex photobleaching behavior18. Error bars represent standard error of the mean (s.e.m.), which is similar to the marker size in many instances. Source data are provided as a Source Data file.

