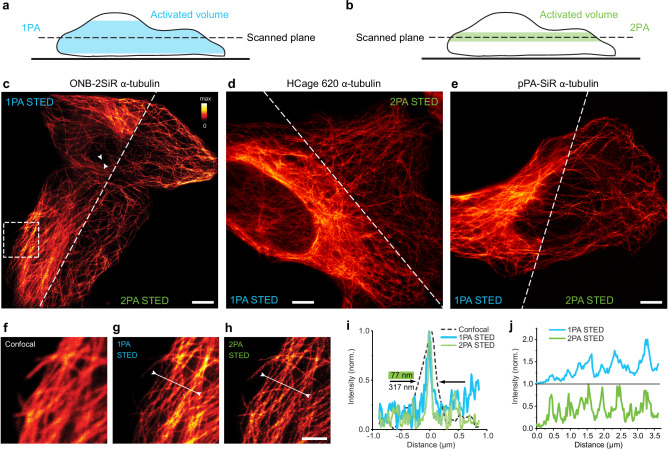
Fig. 3. Two-photon photoactivation enables high-contrast STED imaging in cells due to improved optical sectioning.
a, b Activated volume by scanning a sample plane (schematic) for 1PA a and 2PA b. c–e STED imaging of microtubules in U-2 OS cells labeled with ONB-2SiR c, HCage 620 d and pPA-SiR e, comparing prior photoactivation with 1PA at 375 nm and 2PA at 515 nm. An increased background is visible in the 1PA STED images, especially in thicker regions of the cells. Scale bars c–e: 5 µm. f–h Enlarged view of image region indicated in c, with confocal and 2PA STED image of the same region shown for comparison. Scale bar: 2 µm. i Intensity line profile in position indicated by arrows from both sides in c, for confocal, 1PA and 2PA STED, showing resolution improvement by STED. The resolution of the acquired image is similar for the 1PA and 2PA cases. j Intensity profile lines indicated by arrows and line in g and h, showing contrast improvement for 2PA. Not all microtubles are clearly visible in the profile line of the 1PA STED image, some are lost in the higher overall background. Source data are provided as a Source Data file.

