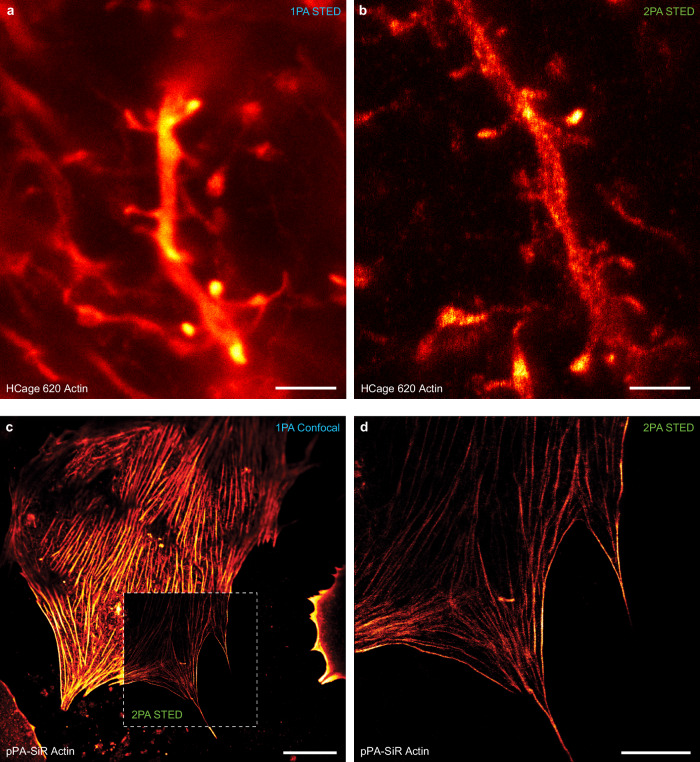
Fig. 4. STED fluorescence nanoscopy with 515-nm two-photon photoactivation of silicon rhodamine dyes in cells and tissue.
(a,b) Actin staining in mouse tissue sample (overexpressed LifeAct in layer V visual cortex dendrites) with HCage 620. (a) Image acquisition after 1PA exhibits significantly higher background due to out-of-focus fluorescence compared to the (b) STED image after 2PA. (c,d) Actin stained in hepatocytes grown in collagen with pPA-SiR as the fluorophore. (c) Confocal overview scan after 1PA. (d) STED image after 2PA. Scale bars: 2 µm (a,b), 20 µm (c), 10 µm (d).

