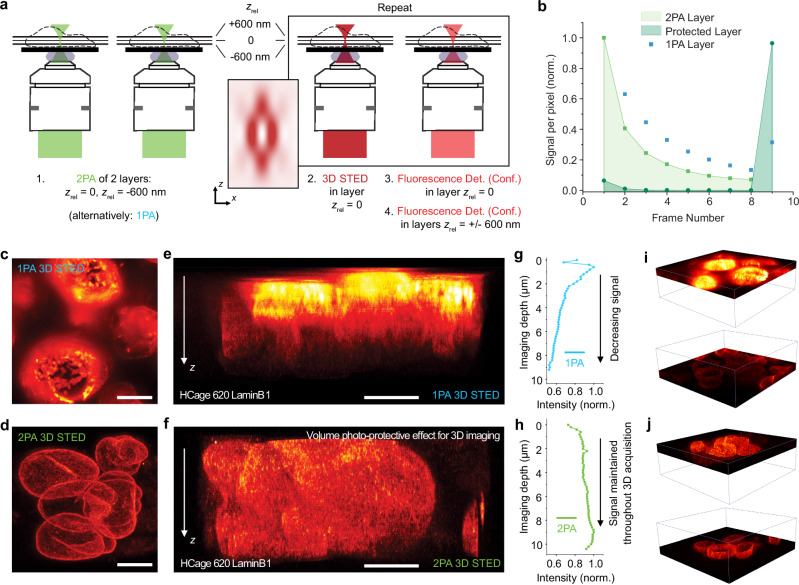
Fig. 6. Photoprotective effect of the sequential layer activation enables high signal retention in STED imaging of 3D volumes.
a Experimental scheme to test photoprotection of not activated layers. Det., Conf.: Detection, Confocal. b Fluorescence intensity of different layers of samples of microtubules in U-2 OS cells labeled with HCage 620 after repeated imaging scans with STED. The detectable signal of the 2PA layer (light green) is decreasing due to cumulative bleaching with the 3D donut. The not activated layer (dark green) is unaffected by the imaging scans, and full intensity can be recovered after all STED imaging scans. In the 1PA case (blue), the fluorescence cannot be recovered as that layer was activated at the start of the measurement due to the z-continuous, undisicriminating nature of linear activation. c–j Volume 3D STED imaging of LaminB1 stained in nuclei of neural stem cells. c, d Maximum intensity projections of image stacks along z, for 1PA c and 2PA d. e, f Cross-sectional y-z images for 1PA e, and 2PA f. g, h Average intensity (normalized to maximum signal) of the acquired layers vs. the corresponding imaging depth, up to ~10 µm, for 1PA g and 2PA h. An approximately even intensity distribution in the axial direction is achieved for selective activation of individual layers and subsequent STED imaging in the 2PA case, whereas the intensity of imaged layers continuously drops in the axial direction for 1PA due to the bleaching of already activated layers. i, j Comparisons of top, initially recorded vs. bottom, later recorded parts of the acquired 3D STED volume stack for 1PA i and 2PA j. Scale bars c–f: 5 µm. Source data are provided as a Source Data file.

