Figure 7.
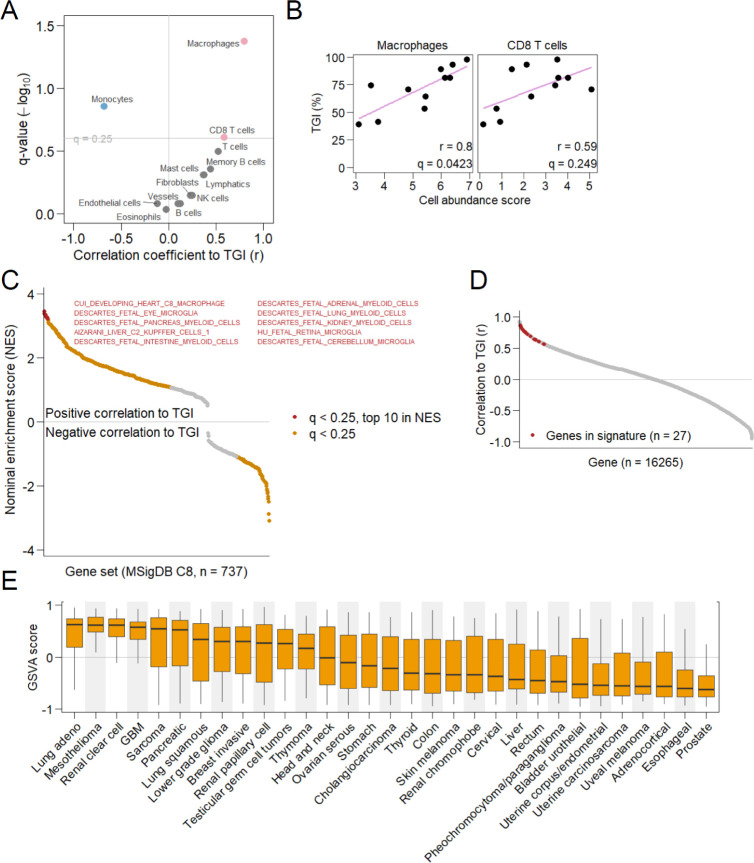
Predictive biomarkers. (A) Correlation of estimated abundance of each cell type to efficacy of 5DEX-0509R. Cell types positively or negatively correlated to tumor growth inhibition (TGI) (q < 0.25) are shown as red or blue points. Pearson correlation coefficients (r) are shown on the horizontal axis. (B) Relation between the abundance of macrophages or CD8+ T cells and TGI. (C) Cell type-specific gene sets associated with efficacy. Gene sets showing significant association between their expression and efficacy (q < 0.25, Kolmogorov–Smirnov test) are shown as colored points. The top 10 strongly associated gene sets in terms of the nominal enrichment score (NES) are shown in red. (D) Correlation between the expression of individual genes and efficacy (TGI). Signature genes are shown in red. (E) Summarized expression levels (geneset variation analysis scores) of signature genes for each patient’s tumor from the Cancer Genome Atlas database. Cancer types are shown on the horizontal axis. The boxplot extends from the 25th to 75th percentile, with whiskers extending to the minimum and maximum values within a 1.5 × interquartile range.

