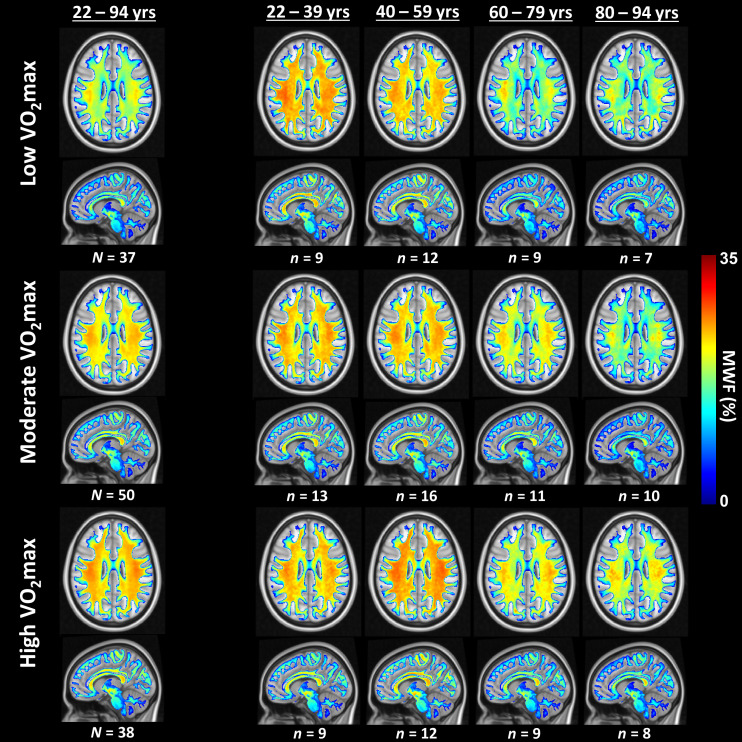
Fig. 1.
Examples of axial and sagittal MWF parameter maps averaged across participants with either lower, moderate, or higher VO2max levels. Participants were drawn from the full age range as well as from restricted age ranges to mitigate the effect of age. Results are shown for representative slices. Visual inspection indicates that, overall, participants with higher VO2max levels exhibit greater regional MWF values, especially at middle and older ages.

