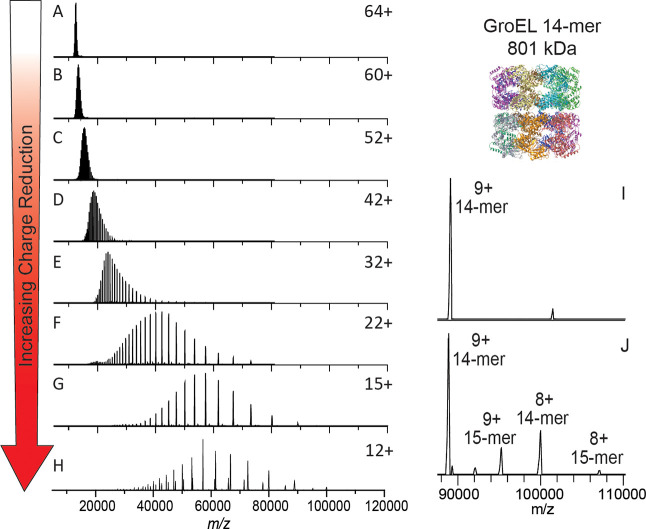
Figure 2.
Electron capture charge reduction of GroEL. Panel (A) shows the mass spectrum of GroEL with the typical charge distribution generated by spraying from ammonium acetate (i.e., no gas phase charge reduction). Panels (B)–(F) show results from increases in electron capture charge reduction, with the device voltages that initiate ECCR increasing in two-volt steps (in-source trapping of −75 V and trap gas setting of 7). Panel (G) is maximum ECCR obtained for this sample (see Table S1). Panel (H) is from a different sample from (A)–(G) and shows more extensive charge reduction with peaks up to 107 K m/z; more 15-mer of GroEL (additional, lower abundance peaks) was present in this sample, an older sample that had aged after refolding (in-source trapping of −100 V and trap gas setting of 8). Panel (I) is a zoom in on the high m/z range of panel (H).

