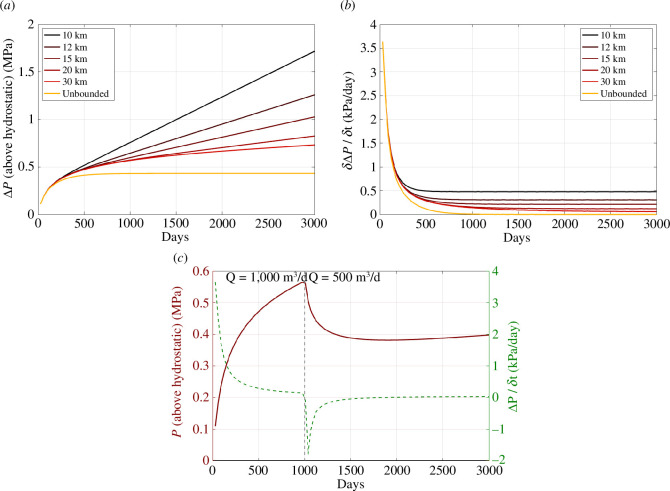
Figure 9.
Reservoir pore pressures (a) and the rate of pressure change (b) at a distance of 1 km from the injection well for our modelled reservoir scenarios. In (c), we plot pore pressures (red) and rate of pressure change (green dashed line) for a model where the injection rate is reduced from 1000 to 500 m3/day at t = 1000 days.

