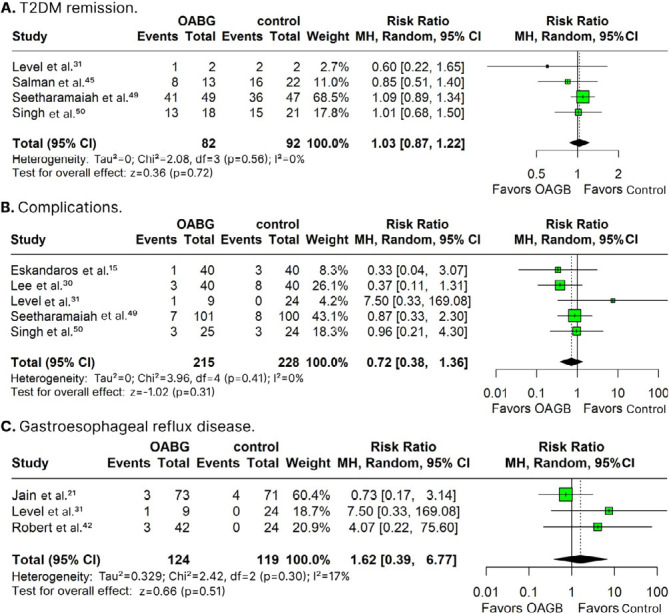
Figure 4. Forest plots of pooled comparisons of type-2 diabetes mellitus remission (Figure 4-A), complication rates (Figure 4-B) and GERD (Figure 4-A) endpoints.

T2DM: type-2 diabetes mellitus; CI confidence interval; OAGB: one anastomosis gastric bypass; SD: standard deviation; df: degrees of freedom; p: p-value; I2: heterogeneity; z: standard normal distribution; MH: Mantel-Haenszel random-effects model.
