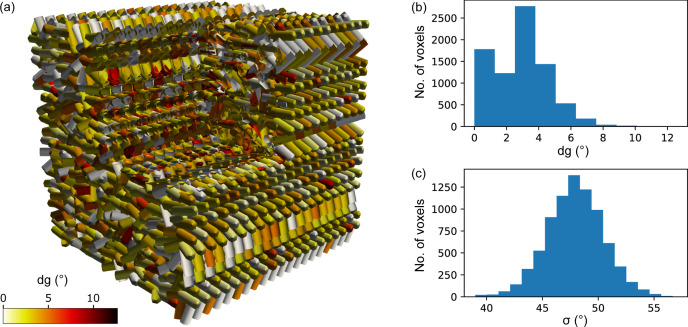
Figure 3.
(a) TexTOM reconstruction of the simulated sample for testing the reconstruction algorithm. The sticks represent the reconstructed preferred orientation of the crystal c axis in each voxel, color coded by the angular deviation dg from the simulation. A corner was cut out to show the interior of the sample. (b) Histogram of dg for the same sample. The distribution of the standard deviations is shown in (c).

