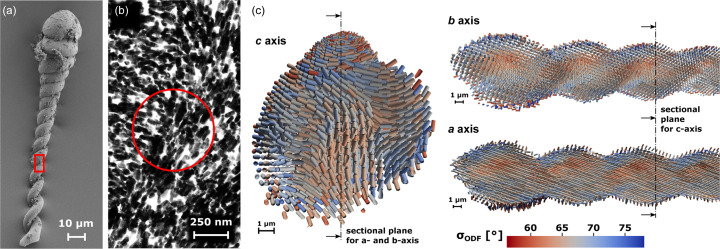
Figure 4.
(a) SEM image of a helicoidal silica biomorph. (b) Arrangement of BaCO3 nanorods (black) in amorphous silica (white) as observed by TEM. For reference, the size of the region shown is given by the red rectangle in (a). The red circle corresponds to the dimension of the X-ray beam. (c) TexTOM reconstructions of a 60 µm-long piece of a helix. Sticks represent the preferred orientation of the indicated crystal axes. The volume is cut in transverse (c axis) and longitudinal (a and b axes) directions, thus showing the interior of the sample. Images were produced using Paraview (Ahrens et al., 2005 ▸).

