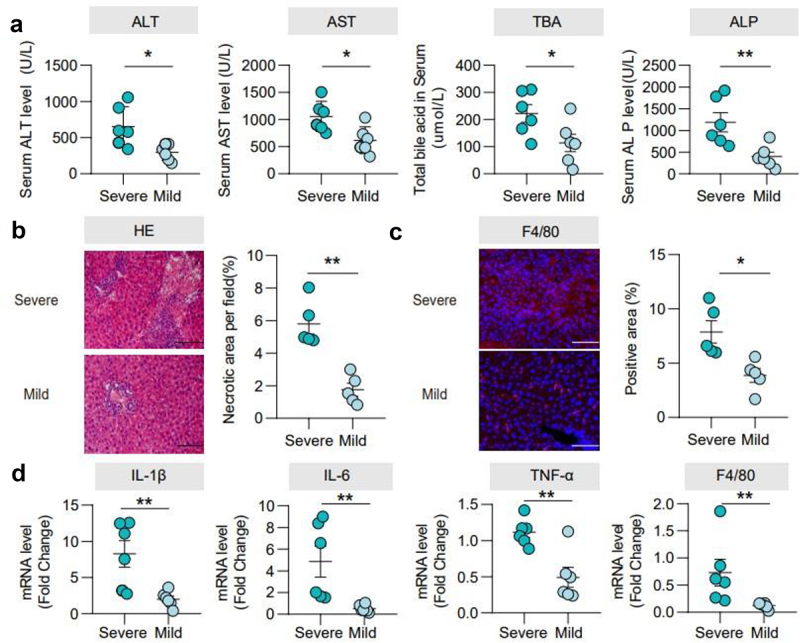
Figure 1.

Characterization of mice with BDL-induced injury. (a). Serum ALT, AST, TBA, and ALP levels. (b). Representative images of the liver stained with hematoxylin and eosin (100 μm) and the quantification of the liver cell necrotic area. (c). Representative images of immunofluorescence analyses of F4/80 (200μm) and the quantification of the positive area. (d). Hepatic mRNA expression of inflammation-related genes. n = 6 individuals/group. Data are expressed as the mean ± SEM. Two-tailed Student’s t-test or Mann–Whitney test. Columns with different letters differ significantly (P < 0.05). *P < 0.05, **P < 0.01. Scale bar: 100 μm or 200 μm.
