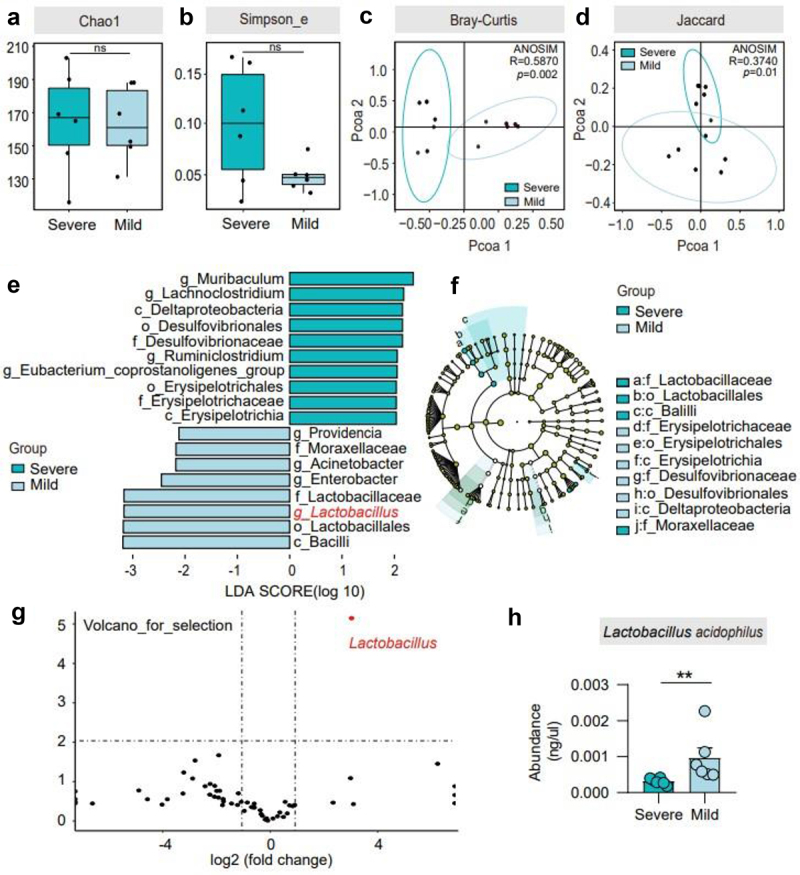
Figure 3.

Different BDL groups showed differences in gut microbiota. (a)-(b). Alpha diversity in the two groups, according to the Chao1 and Simpson_e diversity indices. (c)-(d). Bray–Curtis and Jaccard distances from the two groups were determined by unweighted UniFrac PCoA (principal coordinates analysis) of the gut microbiota. (e)-(f). Cladogram using the LDA model results for the bacterial hierarchy. Differences were represented by the color of the most abundant class. The diameter of each circle is proportional to the abundance of the taxon. Each ring represents the next lower taxonomic level. LEfSe analysis indicated genera strikingly different among the gut microbiota. (g). Volcano plot displaying the relative abundance distribution of microbial OTUs. X-axis, log2 relative abundance; Y-axis, microbial OTU%. Each symbol represents one mouse or bacterial taxa. (h). The abundance of L. acidophilus in the severe and mild groups is shown. n = 6 individuals/group. For (c and d), differences in data were assessed by the ANOSIM test. Exact p levels are provided for all. Two-tailed Student’s t-test. Columns with different letters differ significantly (P < 0.05). * P < 0.05, ** P < 0.01. Abbreviations: OTUs, operational taxonomy units; ANOSIM, analysis of similarities; LDA, linear discriminant analysis; LEfSe, linear discriminant analysis effect size; PCoA, principal coordinate analysis.
