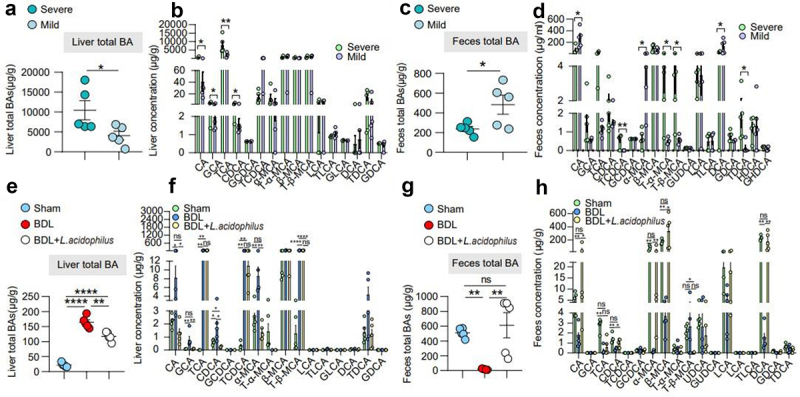
Figure 5.

L. acidophilus inhibited BAs synthesis and enhanced BAs excretion. (a)-(b). Liver BAs classes and BAs profile of mice with severe and mild injury. n = 6 individuals/group. (c)-(d). Feces BAs classes and BAs profile of mice with severe and mild injury. n = 6 individuals/group. (e)-(f). Liver BAs classes and BAs profile of L. acidophilus treatment. n = 6/5/6, respectively. (g)-(h). Feces BAs classes and BAs profile of L. acidophilus treatment. n = 6/5/6, respectively. Data are expressed as the mean ± SEM. Two-tailed Student’s t-test or Mann–Whitney test. Columns with different letters differ significantly (P < 0.05). * P < 0.05, ** P < 0.01, *** P < 0.001, **** P < 0.0001. Abbreviations: BAs, bile acids.
