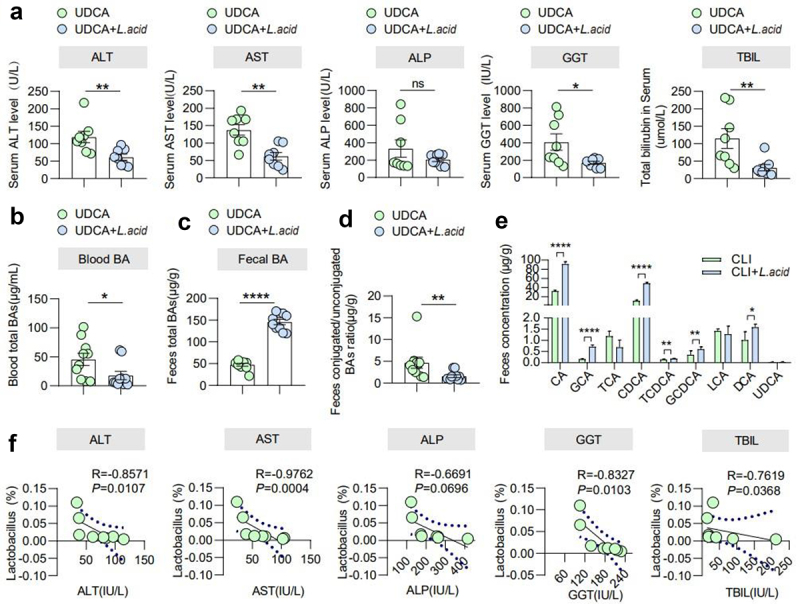
Figure 7.

L. acidophilus promoted recovery in cholestatic liver injury patients. (a). Blood liver features include ALT, AST, ALP, GGT, and TBIL levels in the UDCA and UDCA+L. acid groups. n = 8 individuals/group. (b). Blood total BAs in the UDCA and UDCA+L. acid groups. n = 10 individuals/group. (c). Fecal BAs in the UDCA and UDCA+L. acid groups. n = 10 individuals/group. (d). The ratio of conjugated/unconjugated BAs in feces in the UDCA and UDCA+L. acid groups. n = 10 individuals/group. (e). Fecal BAs profile in the UDCA and UDCA+L. acid groups. n = 10 individuals/group. (f). The correlations between the abundance of Lactobacillus and ALT, AST, ALP, GGT, and TBIL levels were analyzed using Spearman’s correlation. n = 8 individuals/group. Data are expressed as the mean ± SEM. Two-tailed Student’s t-test or Mann–Whitney test. Columns with different letters differ significantly (P < 0.05). * P < 0.05, ** P < 0.01, *** P < 0.001, **** P < 0.0001.
