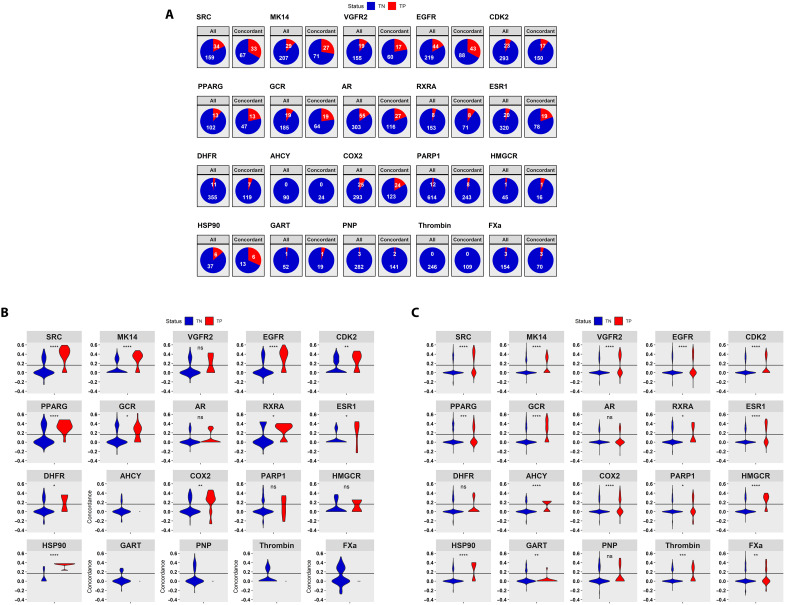
Fig. 8. Performance of ceSAR-S on compounds directly represented in LINCS versus those with LINCS analogs.
Enrichment into true positives by signature concordance for compounds directly included in LINCS is shown in (A); distributions of concordance scores for true positives (TP) (red) versus true negatives (TN) (blue) included directly in LINCS are shown in (B); and distributions of concordance scores for those with LINCS analogs at Tanimoto coefficient of 0.8 or more are included in (C). ns, not significant; *P ≤ 0.05; **P ≤ 0.01; ***P ≤ 0.001; ****P ≤ 0.0001.

