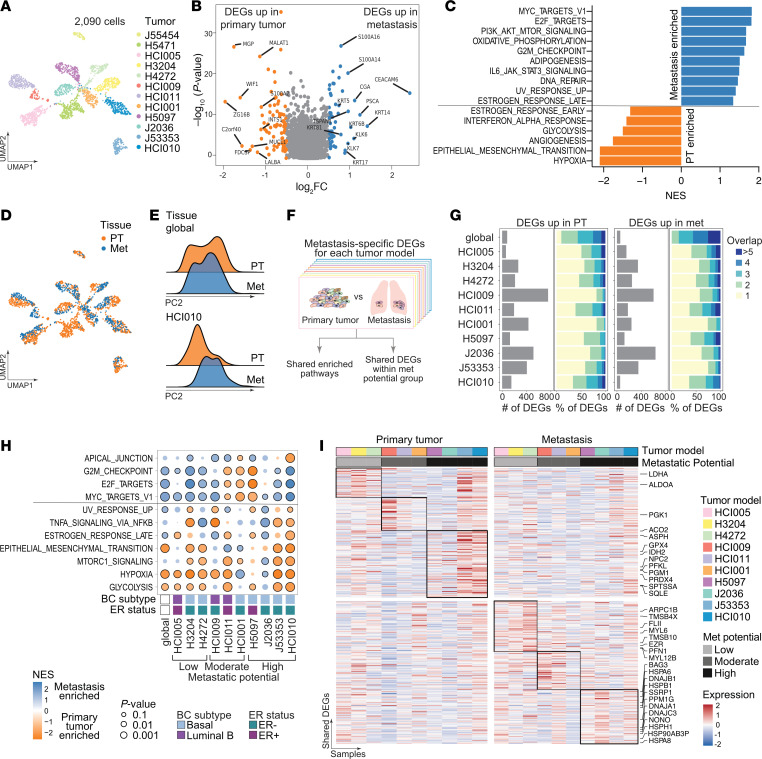
Figure 2. Differential gene expression between primary tumor and matched metastatic cells.
(A) UMAP projection of single-cell transcriptomes color coded by individual models. (B) Volcano plot showing the log2-fold expression change and P value of DEGs in primary tumors versus metastases using the MAST test. The top 10 DEGs are highlighted (orange = upregulated [up] in primary tumor, blue = up in metastases). (C) Bar plot showing pathways enriched in DEGs between primary tumors (negative normalized enrichment score [NES], orange) and metastases (positive NES, blue) using HALLMARK gene sets (MSigDB). (D) UMAP projection of single-cell transcriptomes color coded by primary tumor (orange) and metastasis (blue). (E) Ridge plots showing normalized cell counts along PC2 in primary tumors and metastases for all models grouped (global, upper panel) and a representative individual model (HCI010, lower panel). (F) Workflow for identification of metastasis-specific DEGs in each model. (G) Bar charts showing the number of DEGs (gray bars) upregulated in primary tumors (left) and metastases (right) for each model. Color bars indicate the proportion of upregulated DEGs that are shared between 2 or several models (blue color scale) or exclusive to 1 model (yellow). (H) Bubble plot showing enriched HALLMARK pathways (MSigDB) obtained using DEGs between individual primary tumors and matched metastases that are shared among at least 3 tumors. (I) Heatmaps showing the mean expression of upregulated DEGs between the primary tumor (left) or metastases (right) in individual models that were shared between at least 2 models within the same metastatic potential (black box).

