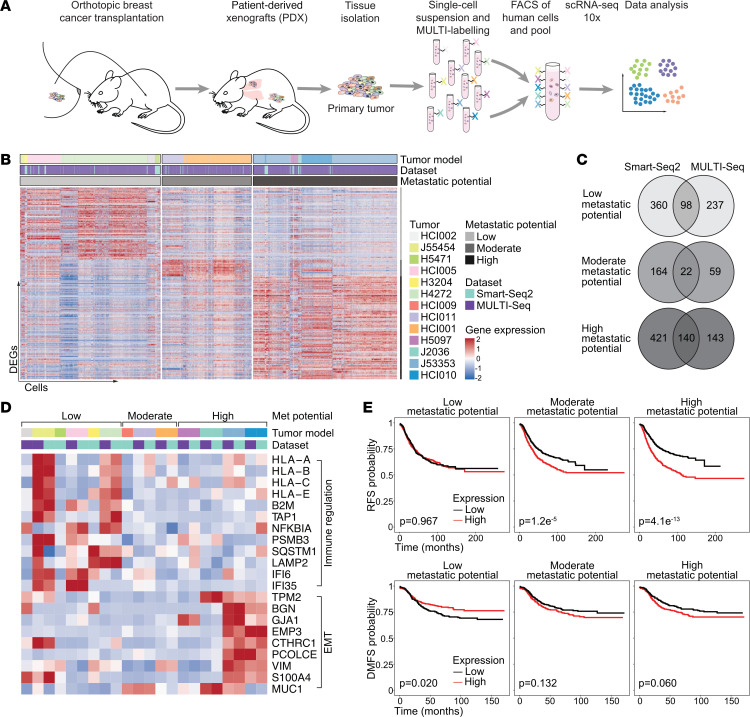
Figure 3. Metastatic signatures are correlated with patient outcomes.
(A) Schematic workflow of the MULTI-Seq experimental setup. (B) Heatmap showing expression of DEGs between individual tumors and tumors of the other metastatic potential groups that are shared between at least 2 tumors. (C) Venn diagram showing the number of DEGs shared between the Smart-Seq2 and MULTI-Seq data sets for the different metastatic potential groups. (D) Heatmap showing the mean expression of selected metastasis-associated genes per tumor model using the same annotations as in Figure 3B. (E) Kaplan-Meier plots showing RFS (top, n = 2,032 patients) and DMFS (bottom, n = 958 patients) of patients with BC using the mean expression of the metastasis-associated gene signatures (generated with KM-plotter) (42). The P values using the log-rank test are shown.

