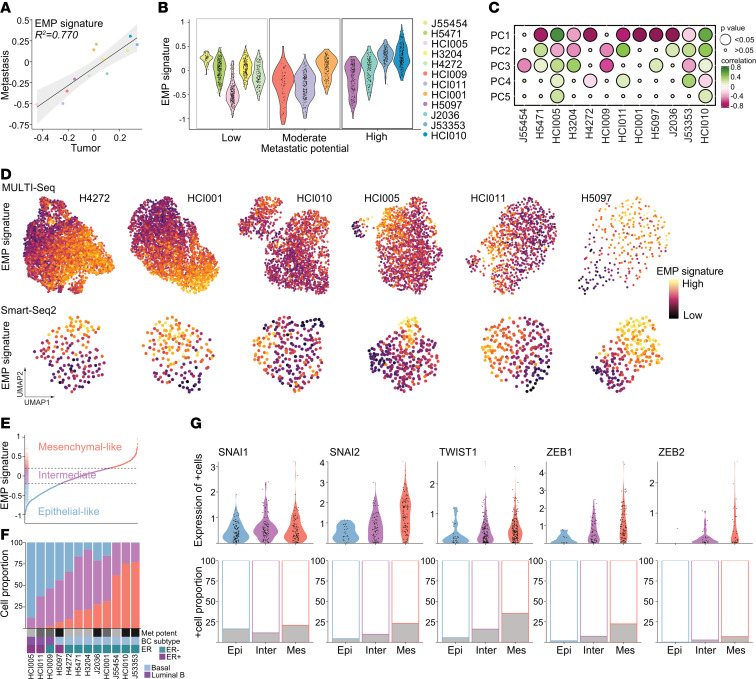
Figure 4. EMP is a key feature of tumor heterogeneity.
(A) Scatter plot showing the correlation of the mean EMP signature gene expression of the primary tumor and metastatic cells colored by tumor. Linear regression with 95% CIs and Pearson’s correlation coefficient are shown. (B) Violin plot showing the EMP signature per tumor ordered by metastatic potential using the Smart-Seq2 data set. (C) Bubble plot showing the correlation of the EMP signature with PCs 1–5 using the Smart-Seq2 data set. (D) UMAP projections of single-cell transcriptomes for individual tumors are color coded by the magnitude of EMP signature gene expression. (E) Cells in the Smart-Seq2 data set ranked by the EMP signature exhibited 3 cell states: epithelial-like (blue), intermediate EMP (purple), and mesenchymal-like cells (red). (F) Bar chart showing the proportion of EMP cell states in each tumor ranked by the increasing proportion of mesenchymal-like cells. Grayscale boxes indicate the metastatic potential. Other annotations indicate ER status and BC subtype. The Smart-Seq2 data set is shown. (G) Violin plots show the expression of EMT-associated TFs in cells expressing these TFs, grouped by EMP cell state (Epi, epithelial-like; Inter, intermediate EMP, Mes, mesenchymal-like cells). Bar charts show the fraction of TF-expressing cells colored in gray. The Smart-Seq2 data set is shown.

