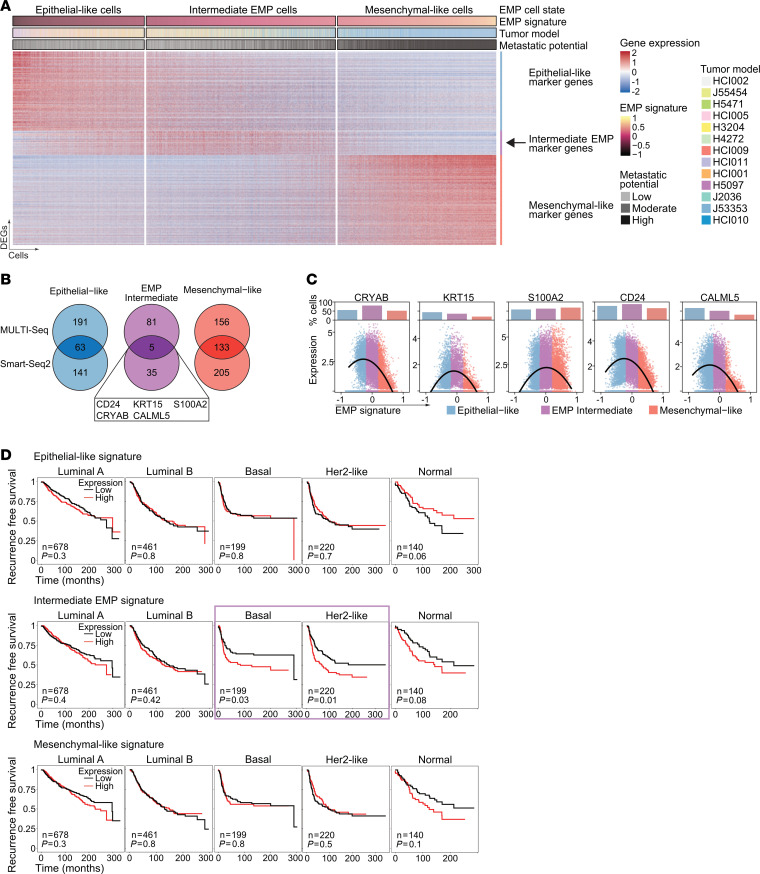
Figure 5. Intermediate EMP cells are characterized by specific markers.
(A) Heatmap showing expression of DEGs for epithelial-like, mesenchymal-like, and intermediate EMP cells from the MULTI-Seq data. Cells are ordered by increasing EMP signature. Annotations indicate the EMP cell state, EMP signature expression, tumor model, and metastatic potential. The arrow highlights intermediate EMP cell marker genes. (B) Venn diagrams showing overlapping DEGs of epithelial-like, mesenchymal-like, and intermediate EMP cells between the Smart-Seq2 and MULTI-Seq data sets. The overlapping markers for intermediate EMP cells are highlighted. (C) Scatter plots show expression of the indicated genes in individual cells ordered by increasing EMP signature expression. The dots show expression levels in individual cells, and lines show smoothed expression of expressing cells. The bar charts on top shows the proportion of positively expressing cells for the EMP cell states. The MULTI-Seq data set is shown. (D) Kaplan-Meier plots show the RFS of patients with BC (METABRIC) stratified by PAM50 BC subtype using the mean expression of the epithelial-like, intermediate EMP, and mesenchymal-like signatures. The number of patients and P value are shown. The purple box indicates data with a significant P value calculated by log-rank test.

